We are regularly enhancing the Near Me widget in Experience Builder to achieve the same level of functionality as the Near Me, Info Summary, Screening, and Situation Awareness widgets in Web AppBuilder. In the February 2024 update, we added support to print report with Near Me results using Enterprise 11.3 custom print service. Please follow this blog to create and publish a custom print service with reporting capability, we will use this to generate preliminary environmental impact assessment report in our sample app. Another big enhancement we added is the ability to use all features from a layer as input search areas in Near Me through Add Data and Map Layers widget.
Let us assume you have a Web Appbuilder app that allows users to find out potential environmental impact of a proposed development project and you would like to migrate the app to Experience Builder. Please follow the steps below to achieve that goal.
Create a new app
First, you’ll create an app in Experience Builder:
- Sign into your ArcGIS account.
- From the Content page, click Create app and click Experience Builder.
- Click Create New.
- Choose a mapcentric template and click Create. I chose plateau template from Web AppBuilder classic template collection for my sample app.
- In your app, add a Map widget. Select a map.
- From the Map widget Content tab, make sure Enable client-side query is Enabled for your map.
I chose a map that has at-risk species, environmentally sensitive and protected features in Maryland state.
- Disable Lock layout option
- Click on the Widget controller widget from top right corner and delete Direction and Draw widget if you do not need them.
- Add the Near Me widget to your app and connect it to the map.
Add and configure the Search widget
You want to provide the option for users to set an address or a location and find out the at risk species or environmentally sensitive areas close to that address or location.
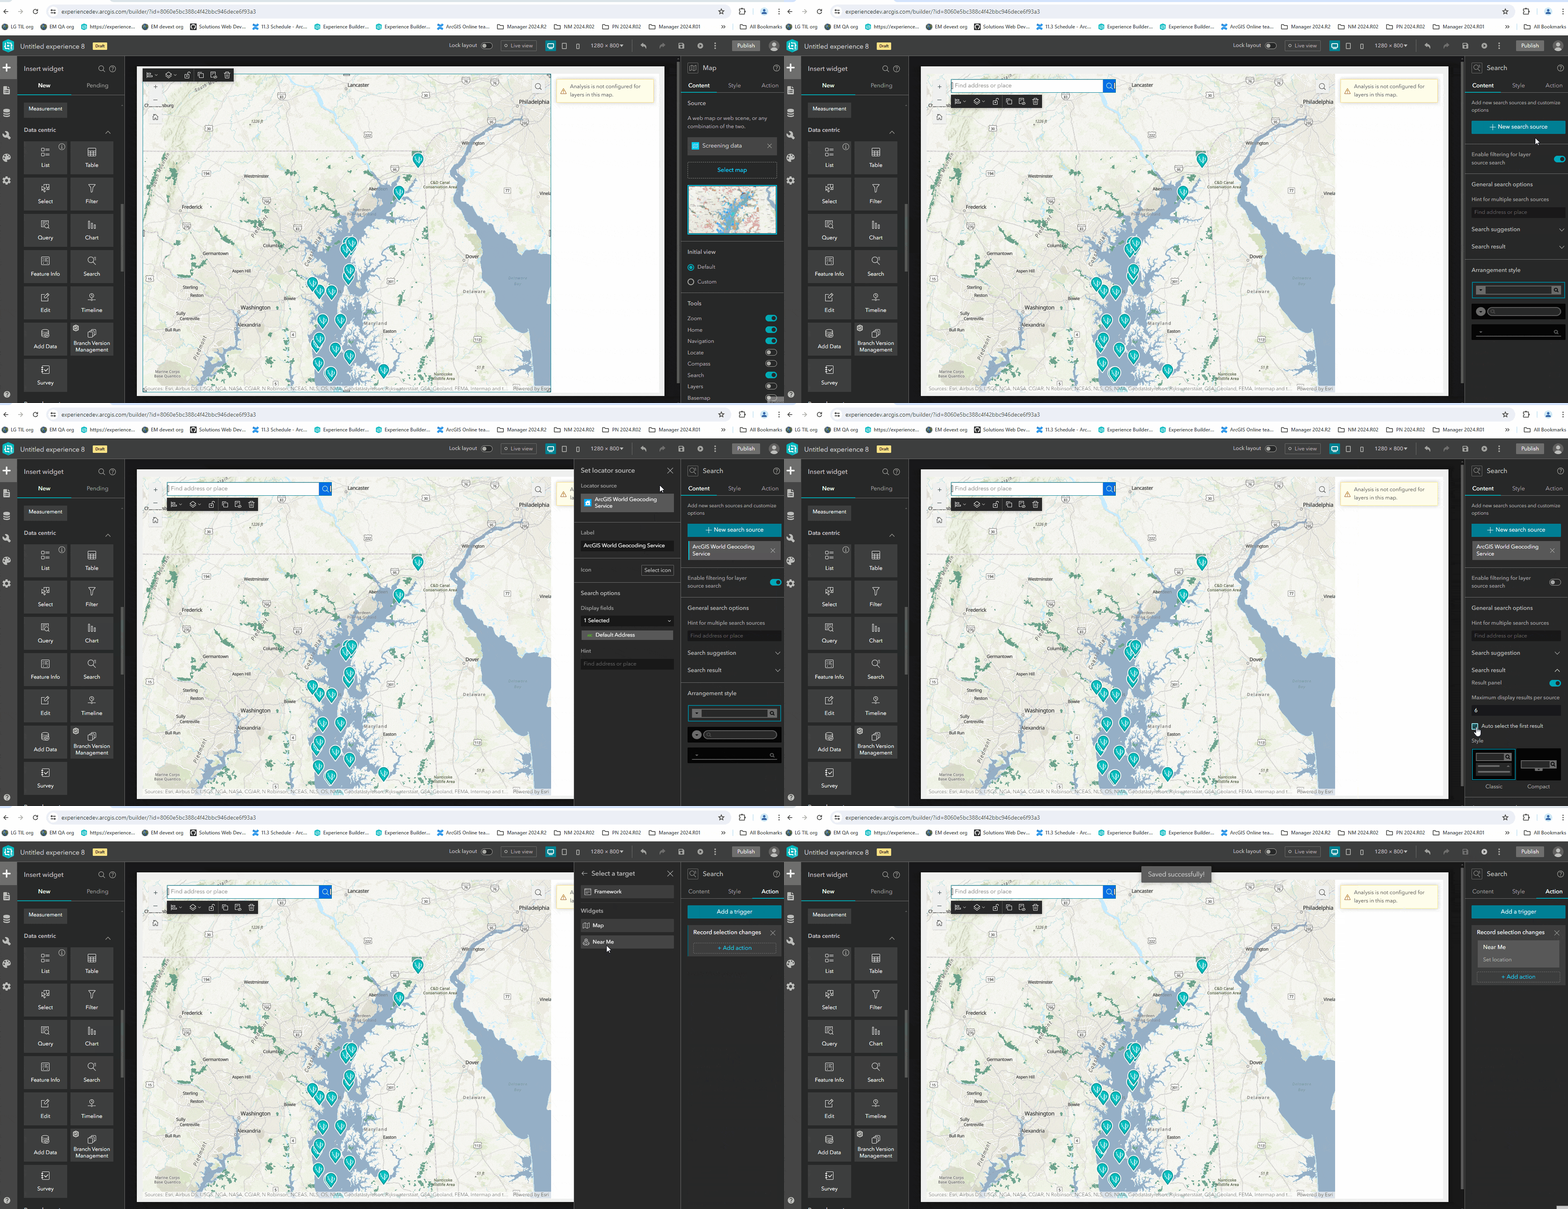
- Click on the Search widget from widget controller.
- Click New search source.
- Click on Locator source, then click on Select utility and select a geocode locator. In the sample app, I used ArcGIS World Geocoding service.
- Make sure that Enable filtering for layer source search is turned off if you configure a feature layer.
- Expand Search result and check Auto select the first result.
- On the Action tab, click Add a trigger.
- Select Record selection changes as a trigger.
- Select Near Me as a target from the Widgets list and Set location as an action to use the searched location as an input location in the Near Me widget.
Configure the Near Me widget
Now that you’ve created your app, you’ll configure the Near Me widget by configuring the map, search, and analysis settings.
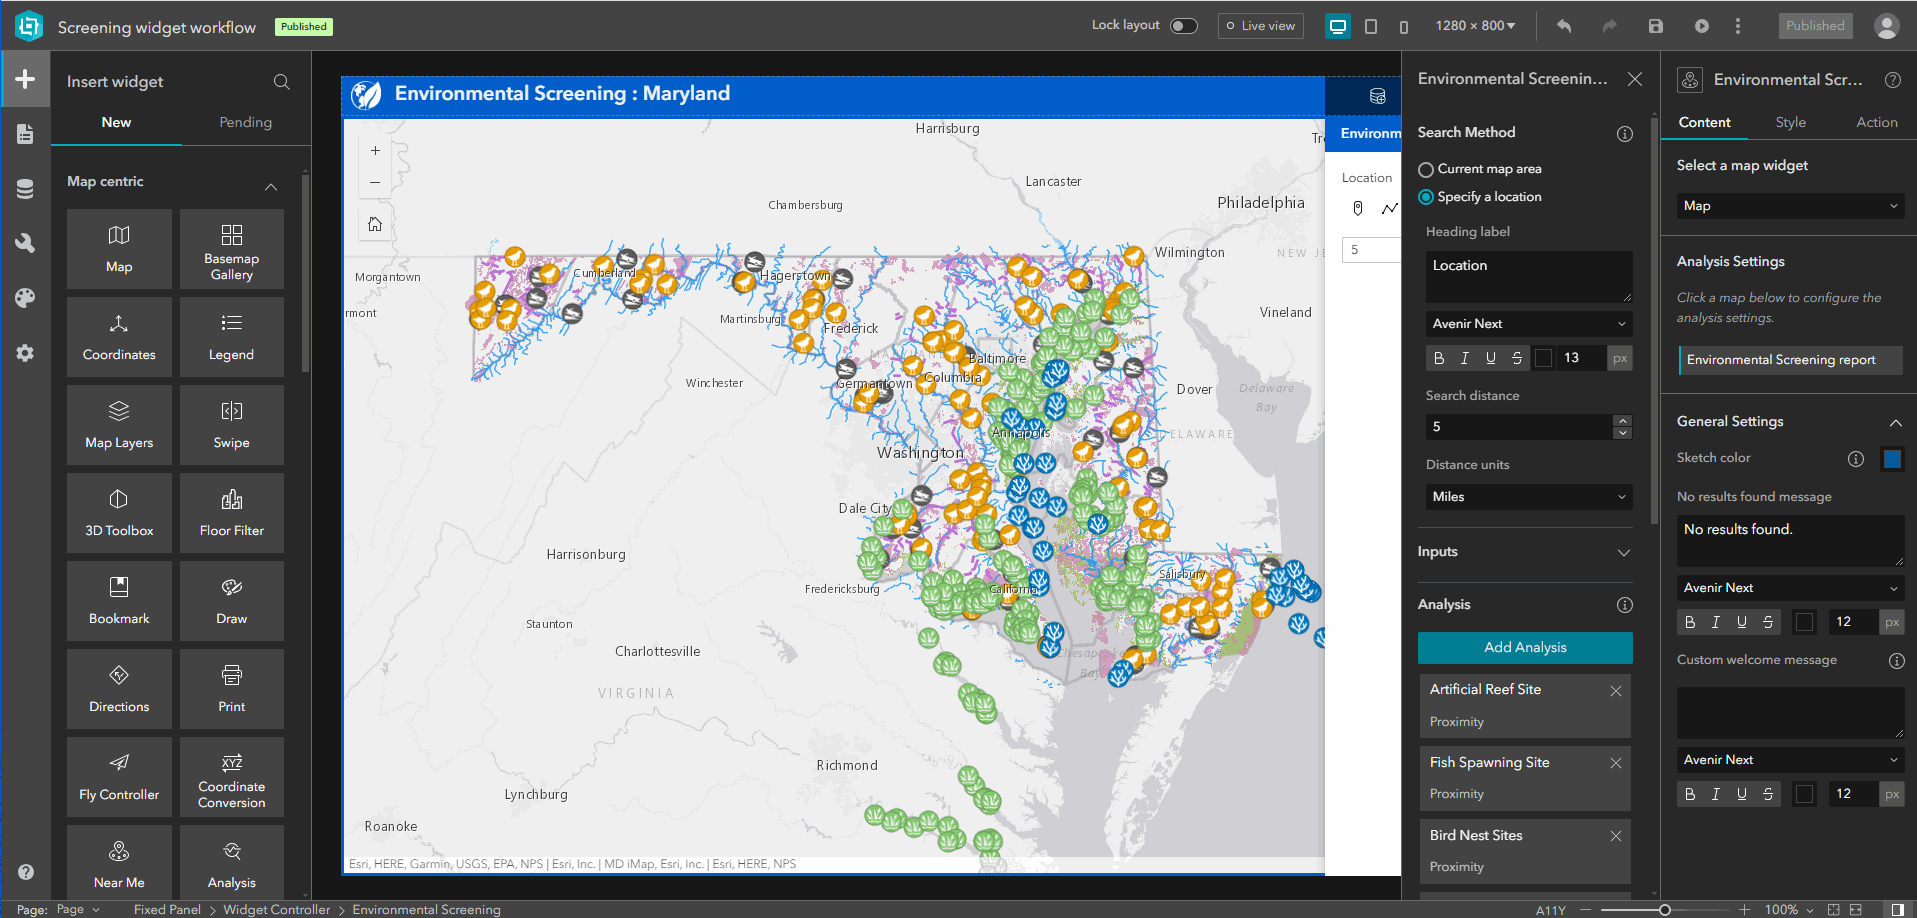
Configure Analysis Settings
- Click the Near Me widget.
- In the Content panel, under Analysis Settings, select your map.
- Click the map to configure its settings.
Define a search method
- Make sure Specify a location is selected.
- Set the default Search distance and Distance units. Because users want to analyze environmental impact within proposed development areas, I set the default distance to 0 miles.
- From the Input section, accept the default values of all the parameters.
Configure Analysis for layers
Setting up analysis is the key step when configuring the Near Me widget, the widget will not work until at least one analysis is configured. To configure the analysis settings for layers, follow these steps:
- Click Add Analysis
- Select the layer
- From the Analysis Types , choose Proximity.
- From the Display field dropdown, choose a field to use as feature title.
- Optionally select Sort and Group features fields if you need to organize your data. I used group features option for some of my layers.
- Save the app.
- Using similar process, configure proximity analysis for all of your layers. In the sample app, I have 12 layers that are configured for proximity analysis.
Results settings
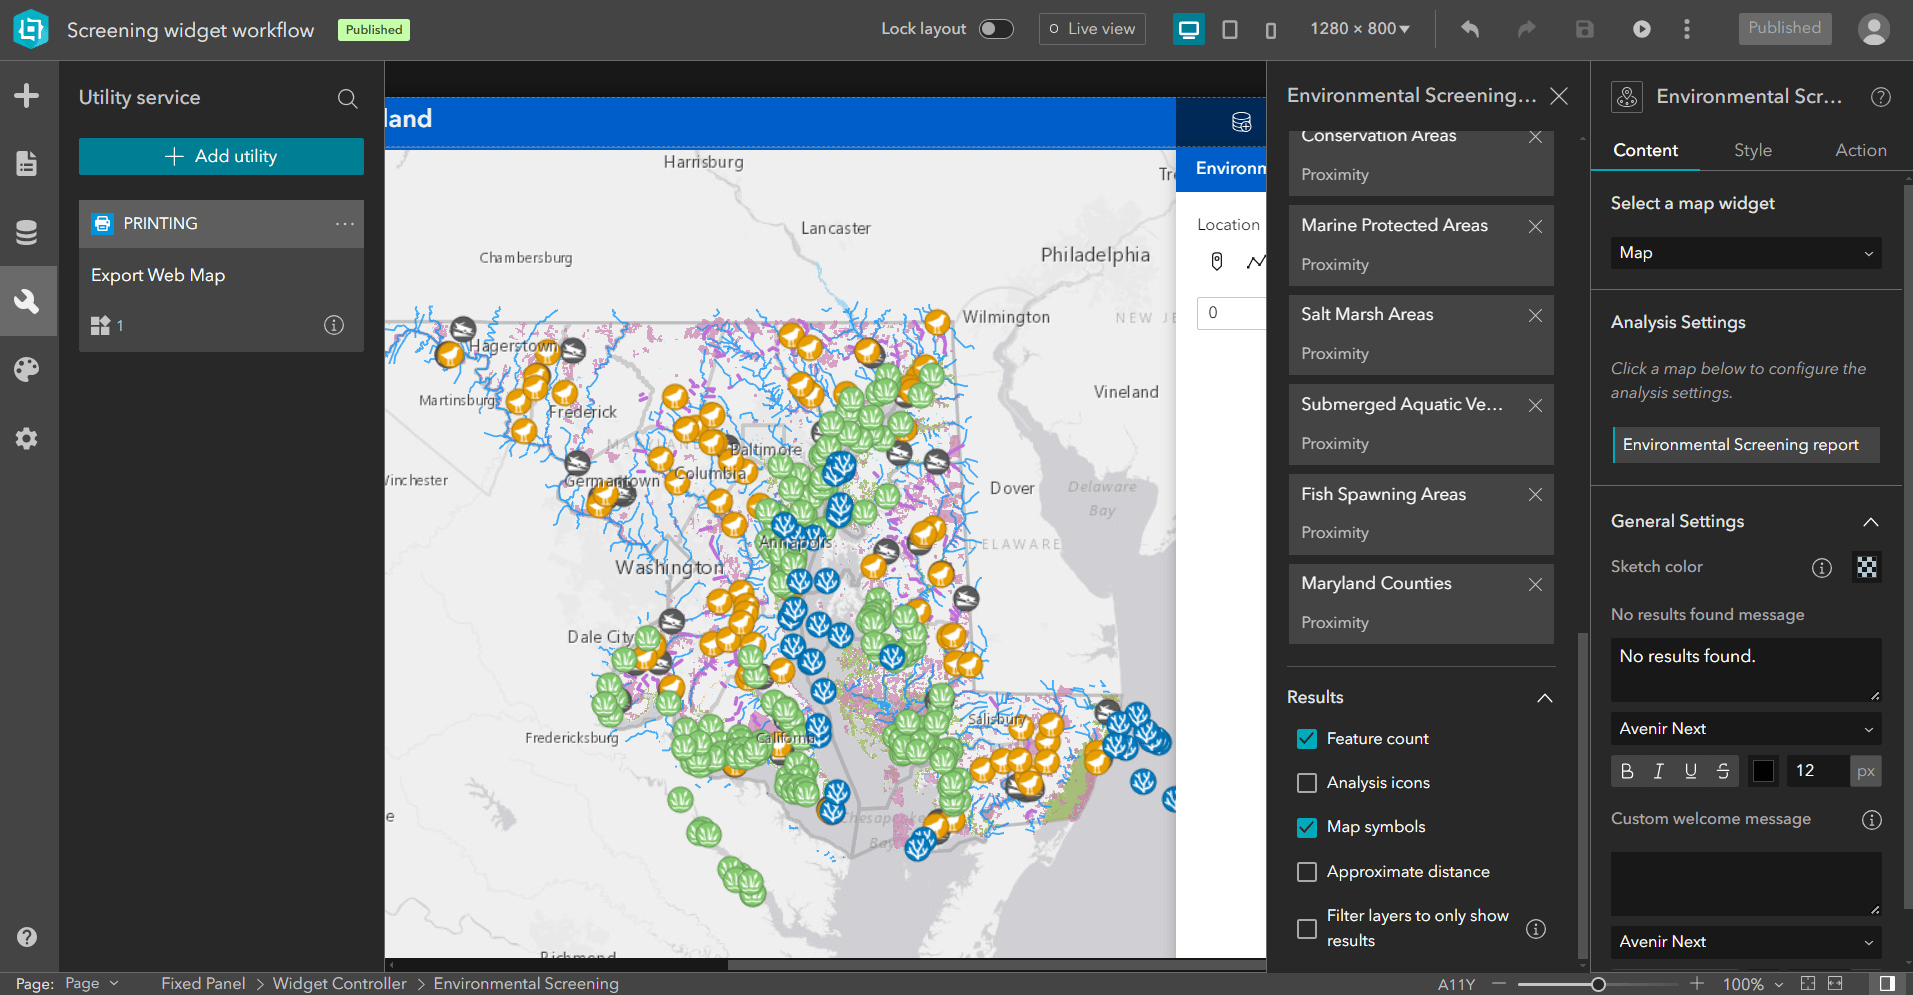
After finish configuring all the analyses, from main configuration panel, expand Results option
- Check Map symbols to show feature symbols in the Near Me widget panel.
- Uncheck Approximate distance off, since we are interested in intersecting features, approximate distance will always be 0 and it will not add any value to our reports.
Add and configure Print widget
In this step you are going to add Print widget and configure the templates to use the reporting templates from the custom Enterprise print service you published by following this blog.
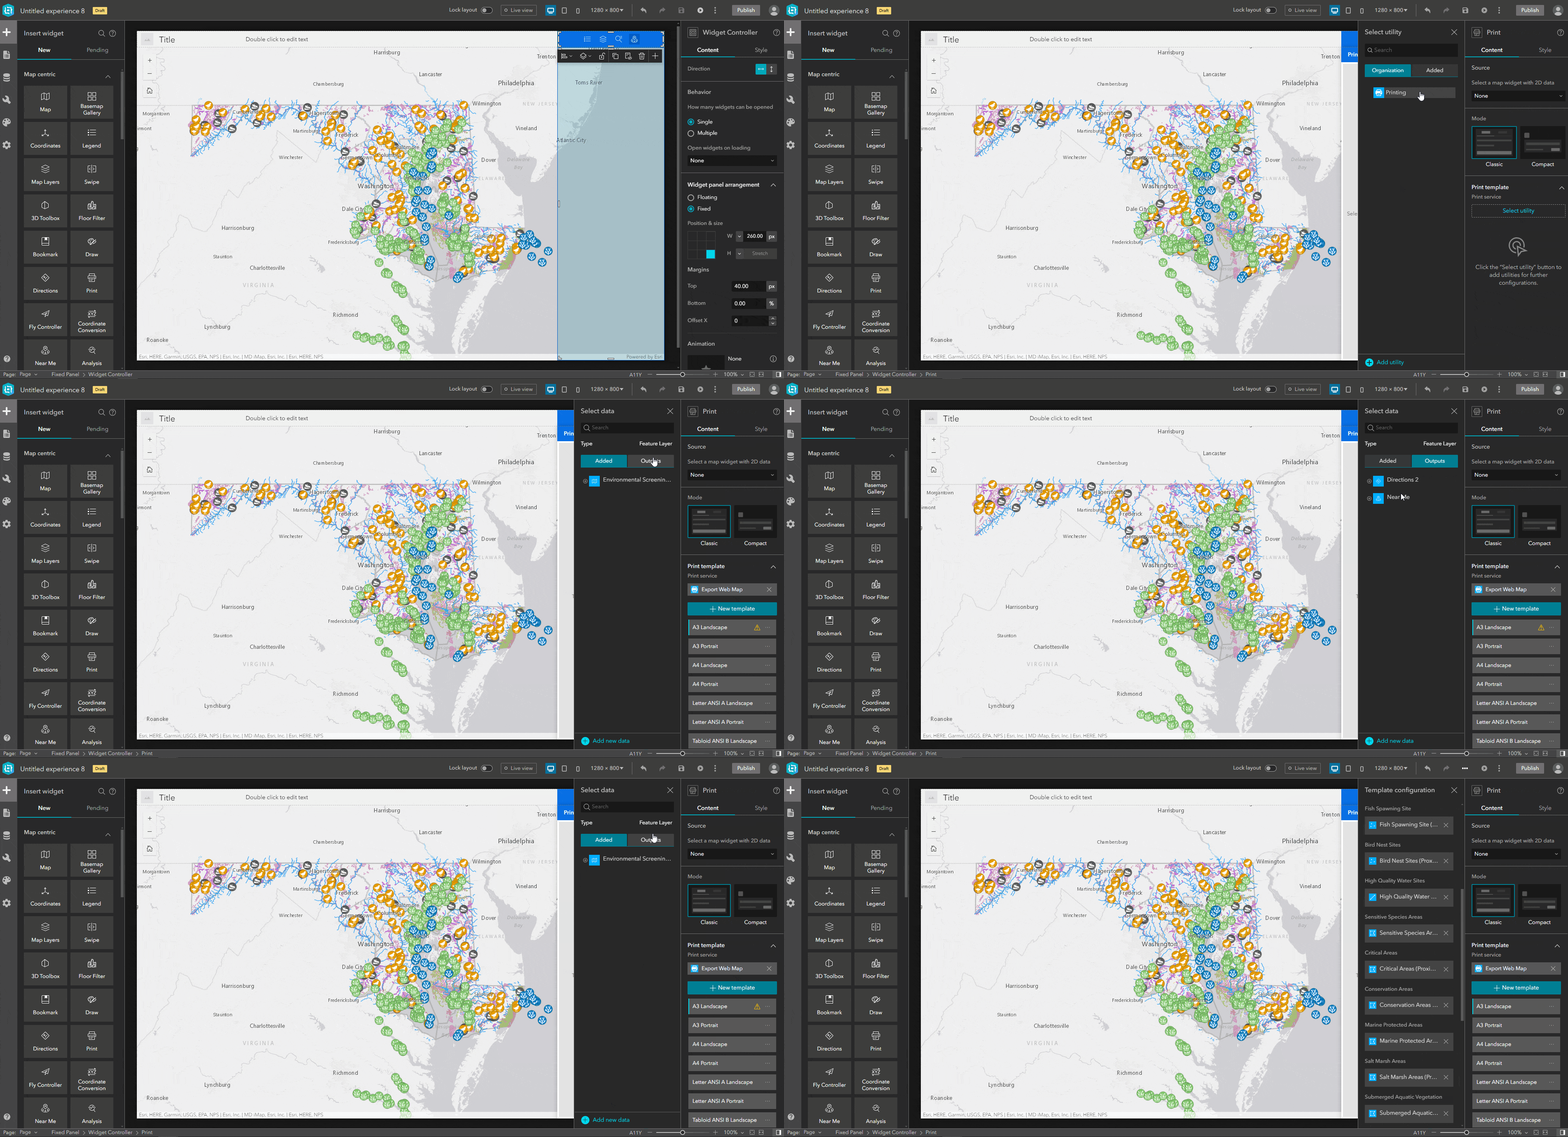
- Add print widget
- From the Print widget Content Tab, in Print template section, click on Select utility.
- In Select utility tab, click on Added tab and then Add utility. Copy and paste your print service url (Export web map url) in the URL input tab, click Add and Done.
- Now go to Added tab and you should able to see your custom print service listed here, select the service.
- Once all the template loads, click on the first template A3 Landscape.
- Select the File format to be portable document format (PDF).
- In the Report section, make sure Use service report is selected.
- From the drop down choose your report. This will load all the reports you have in the selected template.
- Now click on the Select data button underneath the first report name.
- Click on the Outputs tab, then expand Near me and select the output layer result for your report.
- Similarly select data from Near Me output data sources for all of your reports.
- Follow steps 5-11 to configure other layout templates of the Print widget.
- Save the app.
Insert Add data widget
In this step you are going to insert the Add data widget to the widget controller, so you can upload your proposed development area layer and use the layer features as input location to do a preliminary environmental impact assessment.
- Click on the Widget Controller and click + button
- Search for Add Data widget and add.
- Accept all the default configuration parameters and save.
- Click on the Widget Controller widget, in the Content tab, select Single then under Behavior settings and select Add Data to be open on loading.
Environmental impact assessment
Your app is ready for the Natural resource agency staff to conduct preliminary environmental impact assessment. Now to make sure the app is working as expected:
- Launch the app.
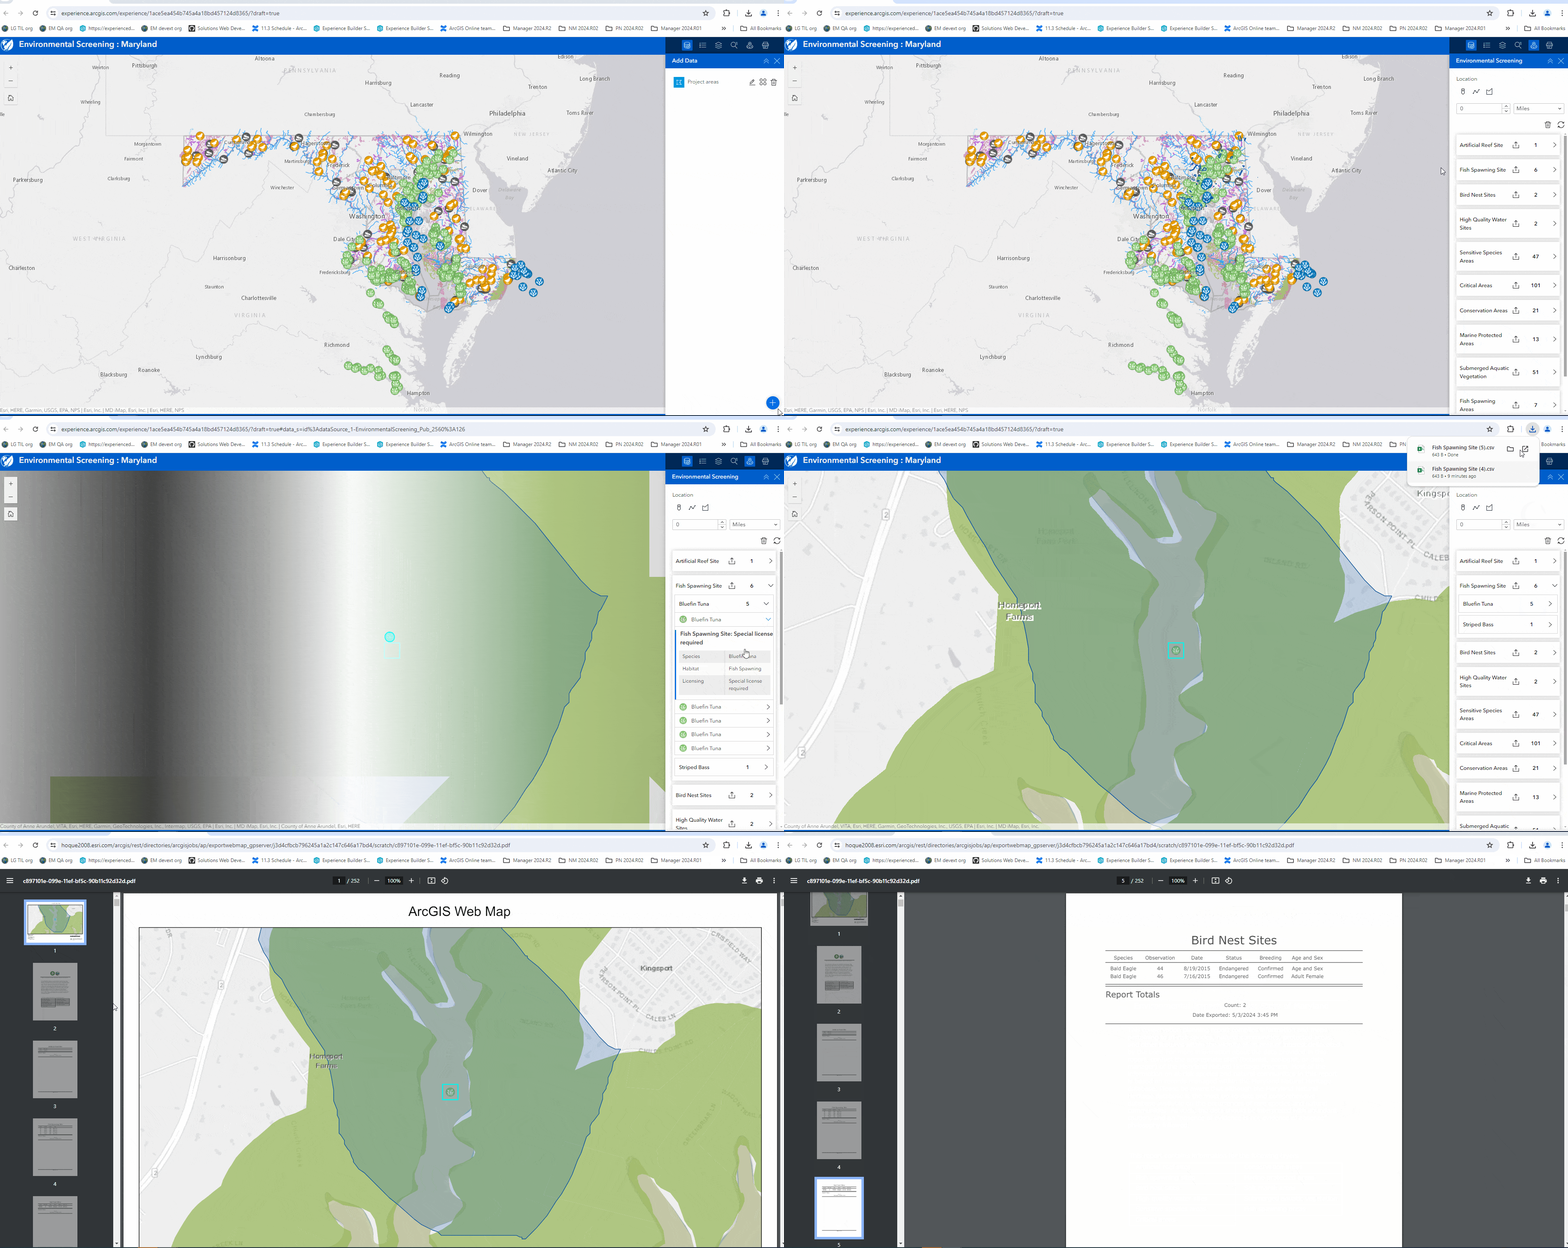
- Click on the Add data widget from Widget controller, press Click to add data button, select URL tab and paste this service url , then click on the Actions button beside the layer and click Set Location from the context menu. A warning sign will appear to caution you about the performance, click proceed if you have small number of the features in the layer otherwise it may take a while.
- Notice that Near Me calculates the intersecting environmental sensitive features within the project areas,
- Expand each layer and explore the results.
- Once you are happy with the results you can either download the results as CSV files or click on Print widget, select a template and click print. Once the print job is done you can navigate and check the printed report. Here is a sample report.
The Print function will not work in the sample app since the service is internal to esri, so I have added a link for a sample report.
Article Discussion: