ArcGIS Insights combines data visualization and analysis to accelerate decision making. From interactive charts and maps to advanced analytics, Insights offers a wide array of capabilities to help you understand your data, answer important questions, and create interactive reports.
The Insights 2023.3 release (November 2023) includes a new filter widget, alluvial diagrams, and north arrows for maps. Keep reading to learn more about these new features so you can try them out the next time you use Insights.
Filter widget
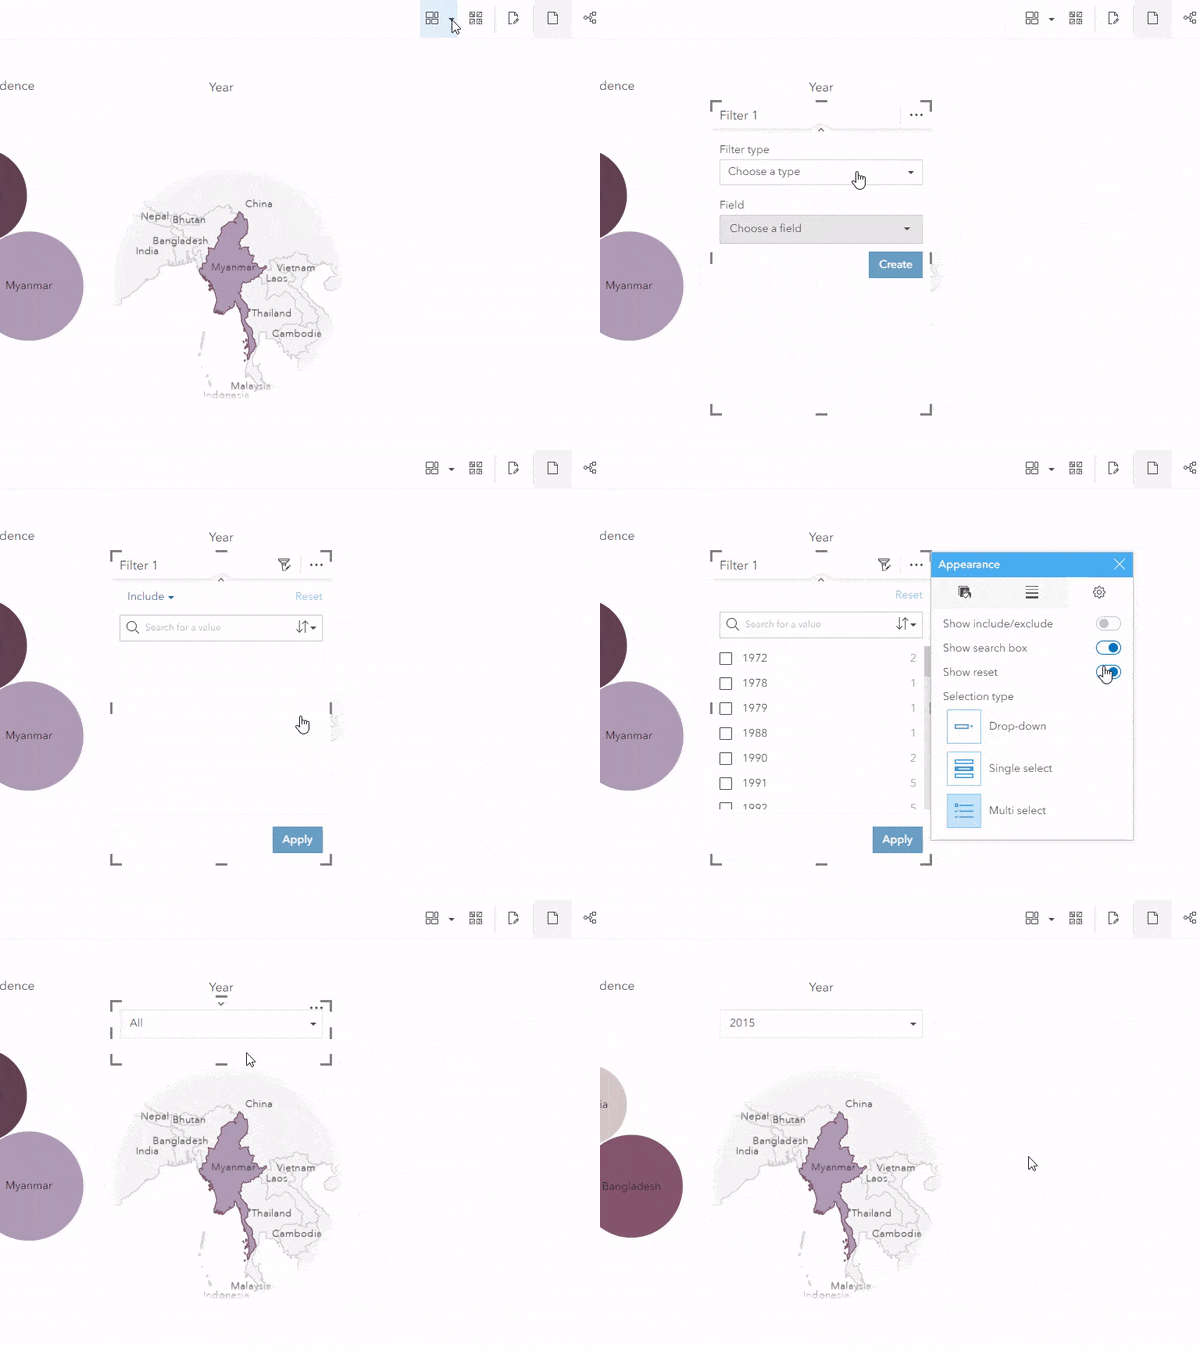
A new filter widget has replaced the predefined filter widget. Filter widgets support all the configurations of predefined filters, plus additional configurations, and improved performance.
Filter widgets are ideal for allowing users to filter data on published reports.

Learn more about the new filter widget
Alluvial diagrams
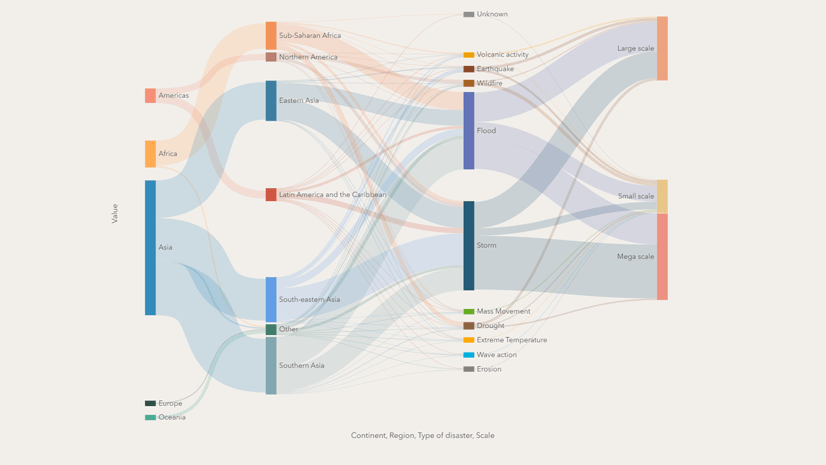
Alluvial diagrams are a chart type that show the relationship between unique values in multiple fields. You can use alluvial diagrams to understand the magnitude of relationships between categories and how objects, people, or phenomena flow between them.

Learn more about alluvial diagrams
North arrow
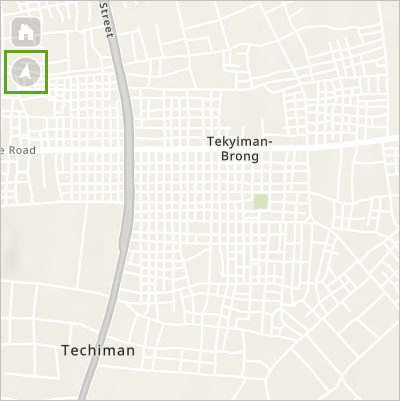
A north arrow can now be added to a map card. North arrows are helpful for orienting maps that have been rotated.

Other updates
- Heat charts and data clocks now support manual classification
- Additional fonts are now available for map labels
More resources
You can now access these and several other enhancements in ArcGIS Insights. For a full list of new features, visit What’s new in the Insights help documentation.
We love hearing from you! Visit Esri Community to ask questions, access resources, and submit ideas for new features you want to see in Insights.
Data attribution
Data from the USDA, Economic Research Service summary of data released by U.S. Department of Commerce, Census Bureau. Downloaded January, 2018.
UNHCR Population Statistics Database. Downloaded September, 2021.


Article Discussion: