We continue to advance and enrich the multidimensional raster capabilities in ArcGIS. The release of ArcGIS Pro 3.2 incorporates various improvements for exploring, analyzing, and sharing multidimensional raster data. Additionally, it introduces several new raster functions and geoprocessing tools designed for raster and image analysis. This blog provides an overview of these updates.
Symbology per variable
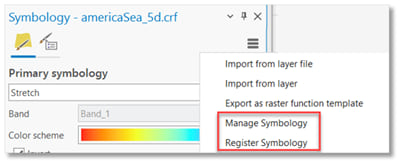
Multidimensional data often contains multiple variables within a single dataset, each with its own value range and properties, requiring specific symbology for effective visualization. In ArcGIS Pro 3.2, the raster layer has been enhanced to support multiple symbologies, enabling users to assign distinct symbology to each variable. The new Register Symbology and Manage Symbology options are used to define and manage the symbologies of the raster layer.
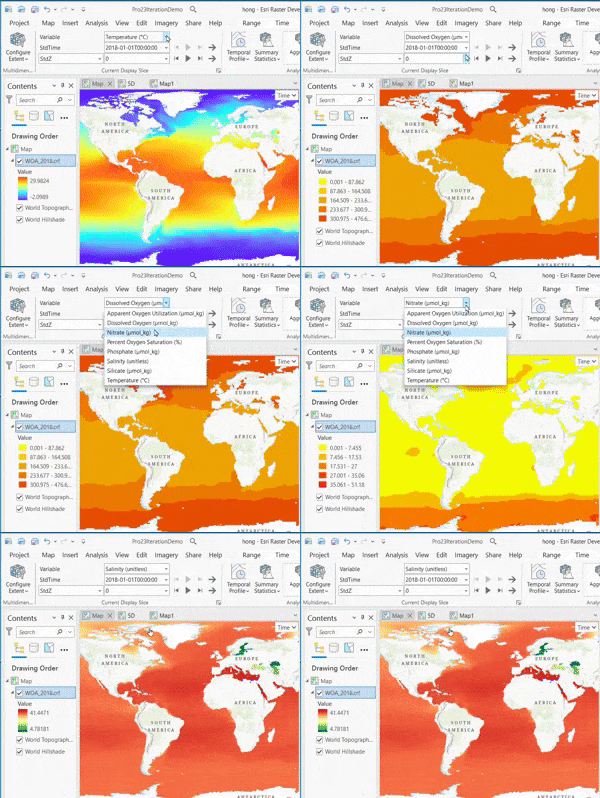
When selecting variables from the multidimensional tab, the predefined symbology for each variable will be automatically applied, greatly enhancing the usability of working with multidimensional raster.
The 4+ dimensional raster support
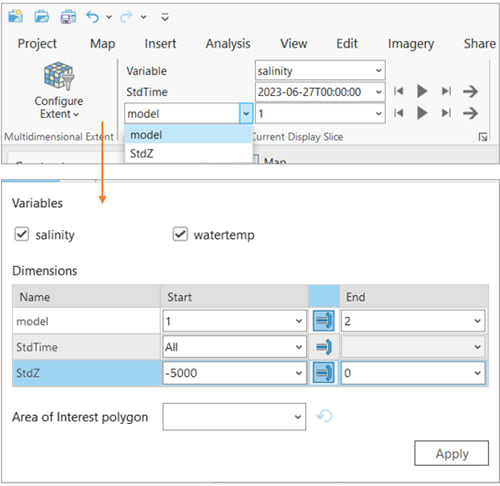
While we are all familiar with multidimensional rasters that contains the time dimension (x, y, time), depth dimension (x, y, z), or both (x, y, z, time), there are instances where users create data with an additional dimension (x, y, z, time, model). To support 4+ dimensional rasters, the multidimensional tab has been enhanced to allow users to select slice(s) of any dimension.
Surface profile
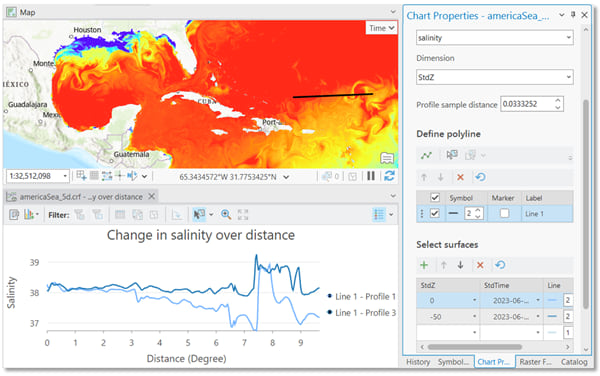
The Surface Profile is a tool for visualizing the surface profile of a raster layer along any given polyline and it supports all types of raster data. For multidimensional raster, the Surface Profile allows you to compare surface profiles of multiple slices of any dimension in a chart. This new Surface Profile as well as the previously released Temporal Profile and the Dimension Profile provide multiple ways of visualizing your multidimensional raster.
STAC support
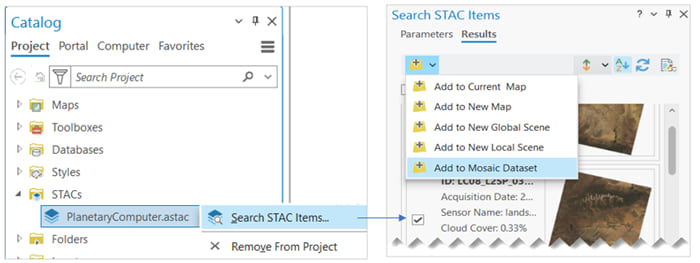
Spatiotemporal Asset Catalogs (STAC) serve as a standard for describing and cataloging spatiotemporal data, providing a unified approach for accessing various forms of spatiotemporal information. Organizations have utilized this standard to facilitate the data sharing in cloud environments. The new STAC support allows you to access and perform analysis using these STAC collections. In ArcGIS 3.2, users can create a STAC connection, search and select collections, catalogs, and assets based on spatial, temporal, and attribute criteria. Once the search results are obtained, users have the option to add them as raster layers or add them into a mosaic dataset.
Publish Zarr as image services
Zarr is an open data format for storing multidimensional data in cloud-based environments. Before Pro 3.2, users could create a multidimensional raster layer from Zarr. In Pro 3.2, we now support Zarr, particularly Zarr variables as raster datasets. you can browse Zarr variables in the Catalog Pane and publish the variables as image services to your Enterprise 11.2
Enhanced table raster type for multidimensional raster
The Table raster type has been enhanced to accommodate multidimensional fields such as Variable, Dimensions, StdTime, StdZ, and others that define multidimensional info for each raster. You can prepare an input table by populating these fields and then add data using the Table raster type. This approach helps prevent unnecessary file openings during adding data to mosaic dataset and expedites data ingestion, particularly in cloud environments.
Enhancements to trajectory data support
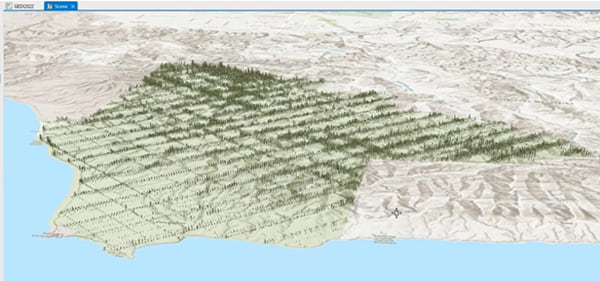
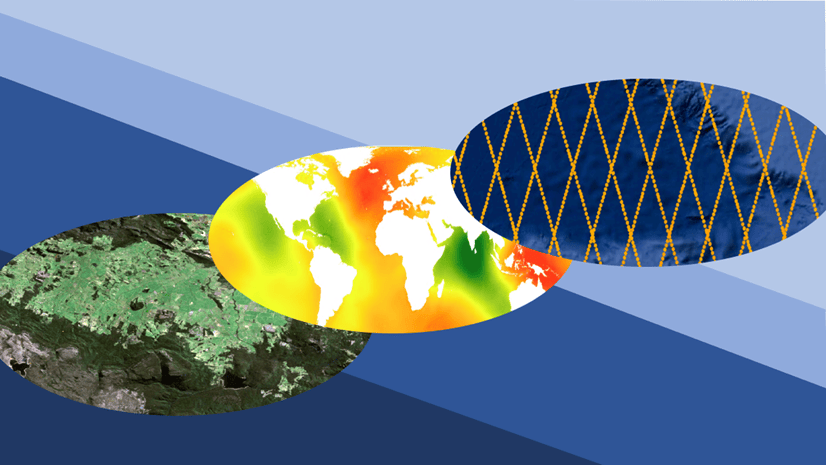
We have added more trajectory types to support Jason-2, Jason-3, IceSat-1, and GEDI data, allowing users to create trajectory datasets and conduct analysis with these data. Below is the GEDI 2A canopy height variable displayed in the Scene.
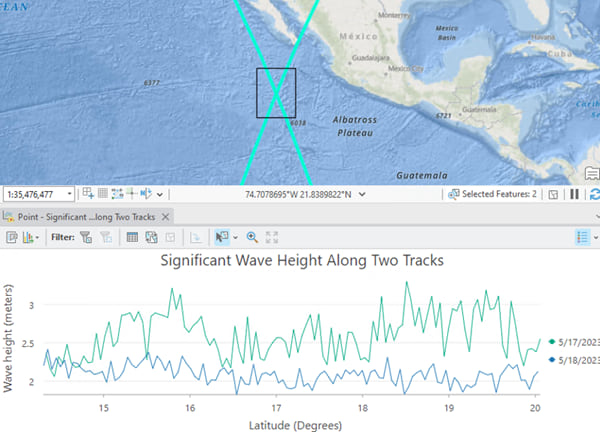
To facilitate exploration of trajectory data, a new Trajectory Profile chart has been introduced. Users can access this chart from a trajectory layer and visualize a variable along a selected track or compare variables across multiple tracks.
Other new raster functions and geoprocessing tools
The Gradient raster function calculates changes or change rates between slices along a dimension.
The Region Pixel Count raster function, as its name suggests, counts the number of non-NoData pixels within a specified region size. It is specifically designed for post-process to eliminate noises, also known as ‘dangling pixels’.
The Create Binary Mask geoprocessing tool provides several methods to generate a binary mask. The Flood Fill option is particularly useful for creating ocean masks, preventing inland water bodies from being identified as NoData in the output.
The New Optimal Interpolation geoprocessing tool implements a data assimilation algorithm, enabling the interpolation of a raster from a background raster and observation data, which can be in the form of point data or a trajectory point layer.



Article Discussion: