We’ve reached our final topic in the understanding network diagrams series. In this three-part series, we’ve covered what they are and when to use them in our previous blog posts. In this blog, we will complete the story, focusing on configuration. Following your review of this series, you should have a solid foundation to move on to intermediate diagram topics.
Network diagrams are a new topic to many people, even if they have previous ArcGIS schematics experience. With this series, we want to reduce the learning curve in this area. This is a general overview of concepts related to network diagrams so that you can get more value out of your utility network or trace network. This is meant for folks just trying to understand network diagrams to get started, move old schematics into network diagrams, or learn how to configure a diagram.
Diagram rules
Early on in this series, we briefly covered diagram rules. Now, we’ll dig deeper and discuss diagram rules in more detail.
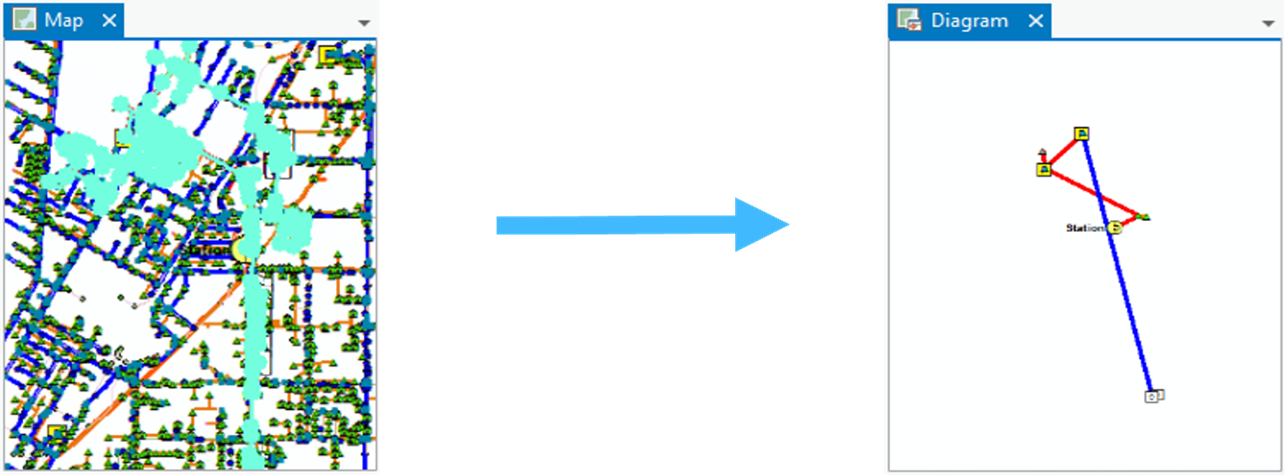
Diagram rules are used to build the diagram features in network diagrams. They start from input network features or object sets and then are used to progressively create the content of the network diagrams at their generation or rerun with each diagram update.
You might ask yourself the question, how? Diagram rules are configured on the diagram template users choose when they generate a diagram. They work in memory to progressively build the diagram contents by doing the following:
- Discarding certain network features or objects
- Adding extra network features or objects
- Simplifying diagram content by aggregating or reducing network features or objects

Diagram layouts
When we produce network diagrams, they can be difficult to read, and features can be too close or distant from each other. The reason for this is that the typical workflow is to select features and create a diagram, and this diagram often opens with diagram features at their geographic positions, and so with overlapping, crossing, and so on. Diagram layouts help us clean up and organize our diagram features.
The primary benefits of diagram layouts are to:
- They clarify and normalize spacing between diagram features.
- They run on demand for all or parts of any open network diagram.
- They can be configured to run at diagram generation and update automatically.

There are three categories of layouts: tree, refinement, and schematic. Tree layouts display features in a tree structure. Refinement layouts focus on using an algorithm to refine diagram edges, which GIS practitioners often refer to as line features. Schematic layouts help separate visually congestive features while preserving their relative position. To learn more, check out the Diagram layouts help topic, which goes into extensive detail.
Diagram templates
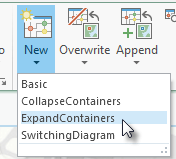
Because diagrams are based on templates, you create a diagram by selecting a diagram template from the Network Diagram tab. The template dictates how to build the diagram, run the rules, and apply the layouts. The template also stores the layer definition, which dictates how you apply symbology.

In short, a diagram template contains the following:
- Configuration properties defining the network diagram contents (that is, diagram rule and layout definitions)
- Layer properties defining the network diagram presentation (that is, diagram layer definitions)
Diagram generation process
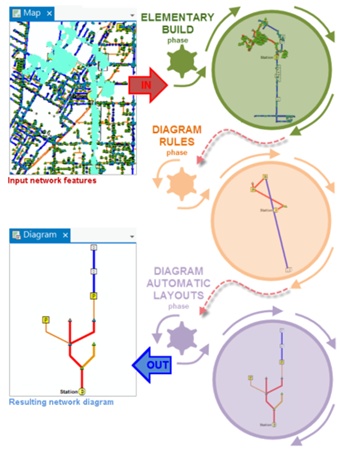
We’ve reached our final section for configuring network diagrams—the generation process. The diagram generation process has three phases, but two are optional:
- Elementary Build
- Diagram Rules (optional)
- Diagram Automatic Layouts (optional)
The Elementary Build phase consists of three fundamental properties: a diagram feature for each input network feature or object, any diagram edge with its extremity junctions, and any content with its container. This is the basis of any diagram.

The Diagram Rules and Diagram Automatic Layouts phases are optional since a diagram template can be configured without any diagram rule nor automatic diagram layout on it.
During the Diagram Rules phase, each diagram rule configured on the template executes each in turn to build and refine the diagram graph. For example, the goal in this phase can be to reduce most of the non-critical intervening elements.
The key concept in the Diagram Automatic Layouts phase is that each is chained to lay out the diagram content. For example, you would run a Smart Tree layout. Note here that the generation process is also like the diagram update process.
Conclusion
You’ve concluded our three-part series on understanding network diagrams, great job. We aim to present you with straightforward methods for using network diagram tools to get the most out of your utility or trace network. Hopefully, you now have a better understanding of how to configure diagrams, what they are, and when to use them.


Article Discussion: