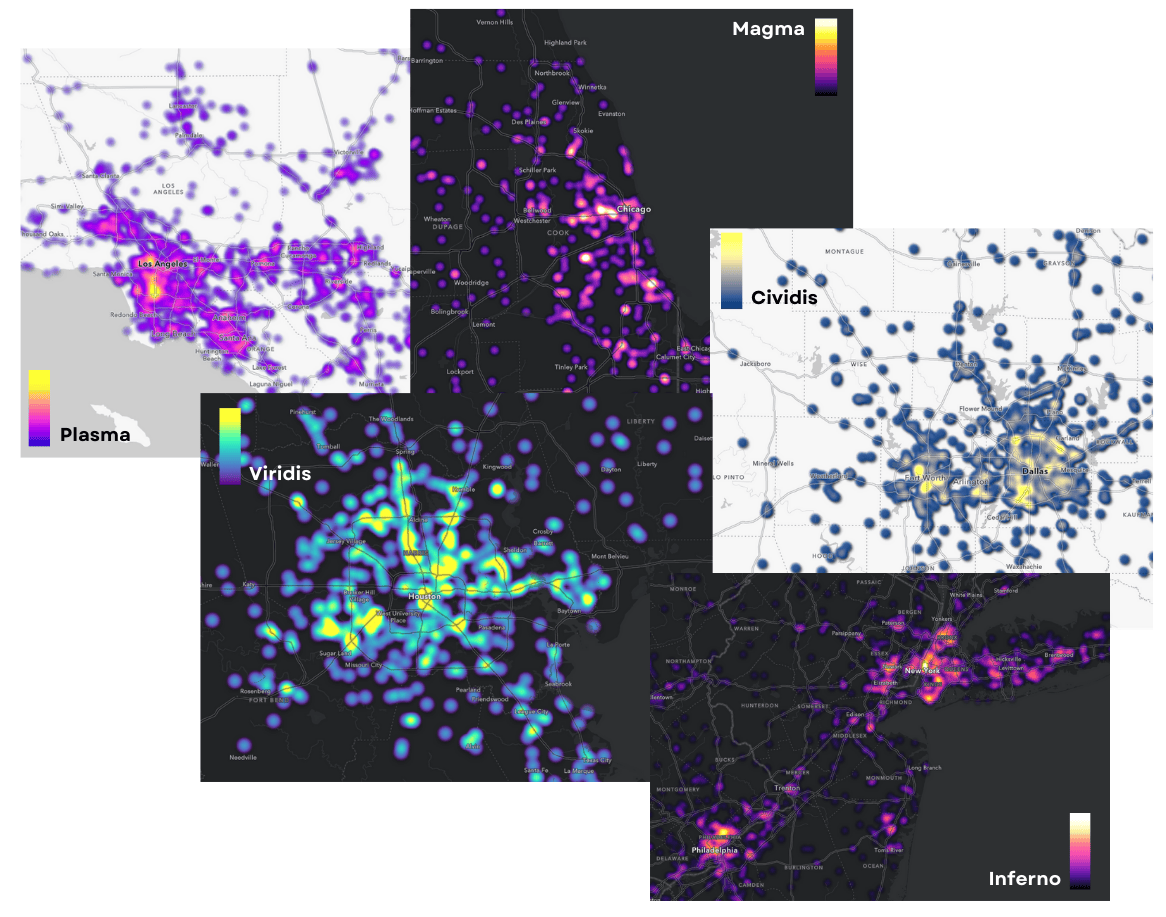
We’re thrilled to announce five new color ramps in Map Viewer for the heat map and color styles: Plasma, Cividis, Viridis, Magma, and Inferno. Also incorporated in ArcGIS Pro, these scientific ramps have been crafted to improve support for color vision deficiencies and elevate data visualization on the web.
Map viewer periodically adds color ramps, enriching the web-based mapping experience. For example, in the June release, mapmakers were introduced to more than thirty new color ramps specially designed for working with Themes such as “Extremes” or “Centered on” with numerical attributes.
Smart mapping is a powerful tool that revolutionized cartography on the web by suggesting defaults based on statistics queried from your data. It is an excellent starting point and provides an immersive, data-driven exploration experience.
Here is an example of a web map authored to visualize reported motor vehicle accidents in the United States. When utilizing the Heat map style, smart mapping recommends default colors ramp tailored to the theme of the basemap- light or dark.
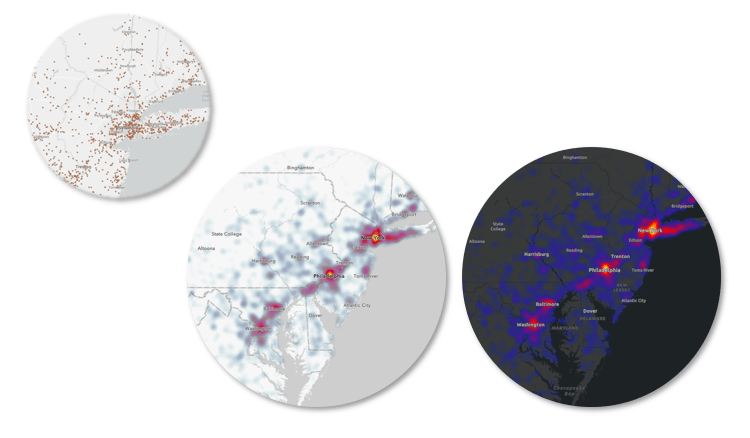
Using this as a starting point, we can go beyond the defaults and engage with the dataset – refine the hotspot edges, adjust the area of influence, and regenerate or lock the heat map to make a meaningful map that resonates with the audience.
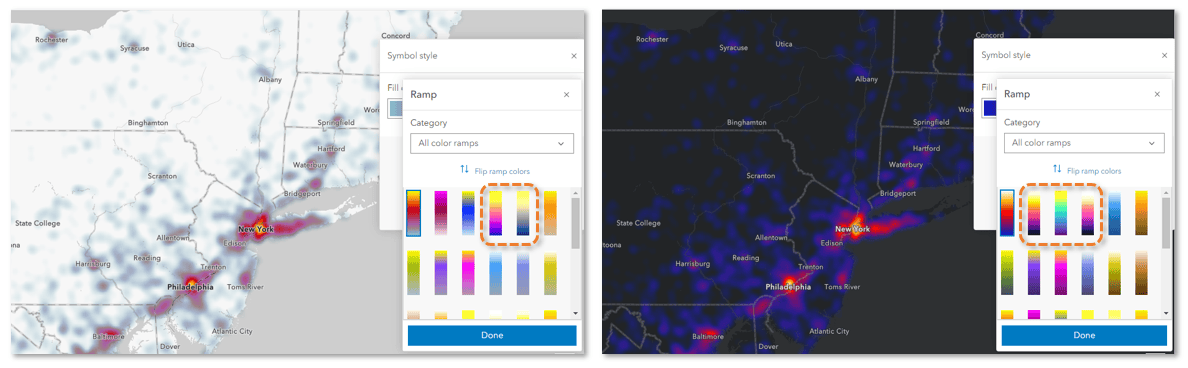
Map Viewer has refined the categorization of color ramps, aligning them with the basemap theme leveraged in the web map. For instance, when using a dark basemap, brighter color ramps are prioritized at the top of the list to accentuate patterns within our data. In the following images, observe how smart mapping intuitively suggests color ramps that complement the basemap. Additionally, spot the five new ramps!
The new ramps are colorblind-friendly, they enhance color variations for the most prevalent forms of colorblindness. The next video simulates three types of color vision deficiencies when using one of the new color ramps for data visualization, Plasma.
Color theory is an indispensable element in map design, influencing how we engage and interpret geographical data. A thoughtfully selected color ramp is one of the key ingredients to creating a meaningful map, that visually tells us a story.

Article Discussion: