ArcGIS Online lets you understand the world around you by using interactive maps to connect people, locations, and data. You get smart, data-driven styles and intuitive analysis tools that deliver location intelligence. ArcGIS Online gives you the ability to make maps and apps to share your insights with your organization or the world. You can use it as a complete, cloud-based solution or to extend and complement the capabilities of ArcGIS Pro and ArcGIS Enterprise.
Don’t have an ArcGIS account? See Create an ArcGIS Account.
The October 2023 update includes new functionality in Map Viewer, such as additional analysis tools and raster functions, time zone settings, plus other enhancements and new capabilities throughout the ArcGIS Online website. Highlights are provided below.
ArcGIS Online is updated three times each year. See the ArcGIS blogs to learn more about previous updates to ArcGIS Online and new functionality and enhancements you may have overlooked.
For more information and additional details about this release, see the What’s new help topic or view all posts related to this release.
Don’t have time to read the blog article? View the video below instead.

Quick links
Use the links below to jump to sections of interest.
- Accounts and administration
- Map Viewer
- Analysis in Map Viewer
- Scene Viewer
- ArcGIS Instant Apps
- ArcGIS Dashboards
- ArcGIS Experience Builder
- ArcGIS Notebooks
- Data management
- Data Pipelines (Beta)

Accounts and administration
Multifactor authentication
Multifactor authentication (MFA) is an authentication measure that requires the user to provide multiple verification factors, improving security. Administrators can now enforce multifactor authentication across their organization to ensure that members with ArcGIS logins are in compliance with security policies when signing in to ArcGIS Online. When multifactor authentication is enforced, members with ArcGIS logins will be required to set up multifactor authentication for their accounts in order to sign in.
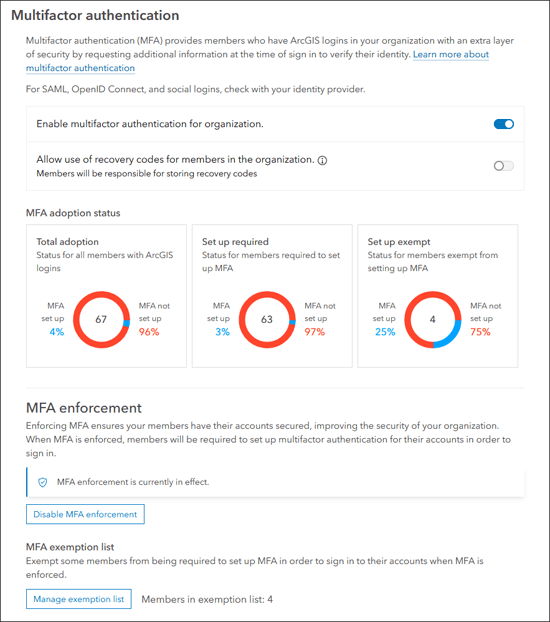
Once established, members signing in with an ArcGIS account will be required to use an authenticator app using a Time-based One Time Password (TOTP) such as Google Authenticator and others. Members can also set up security keys using options such as USB keys, Face ID, fingerprint readers, and phones. For more information, see Multifactor authentication.
Custom role for administrative reports
ArcGIS Online defines a set of privileges using default roles (such as administrator, or viewer) which can be refined using custom roles. Administrators can now configure a custom role that allows members to create and manage administrative reports without having other administrative privileges.

Map Viewer
Using Map Viewer, you can author, explore, edit, and share web maps. Administrators and members are encouraged to configure Map Viewer as their primary map viewer to take advantage of new capabilities and enhancements that are delivered with each update.
Here’s an overview of new features and enhancements to Map Viewer delivered in this update.
Pop-up element improvements
When adding chart elements to pop-ups, you can now select custom colors and color ramps. You can use this new capability to configure charts to use the same colors which are defined in the data layer styling, or apply custom colors to focus on specific chart data.
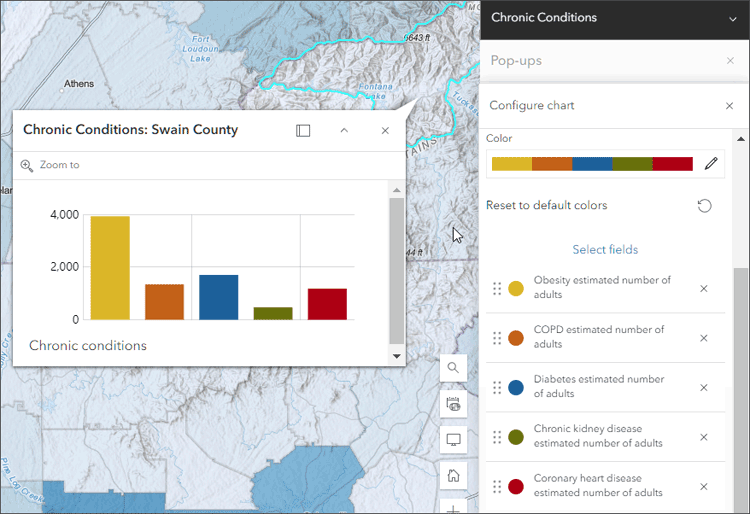
See Introducing custom colors in pop-up charts for more information.
Pop-up text elements have also been enhanced. You can now select fields and expressions from the new Fields List drop-down and apply custom colors using a new color picker. In addition, a new chart tool has been added. See Add text for more information.
Box plots
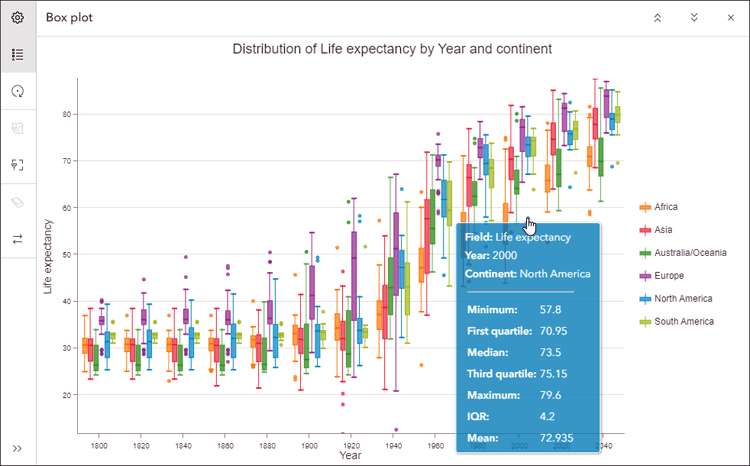
Charts created from hosted feature layers or tables can now be configured with box plots. Box plots allow you to visualize and compare the distribution and central tendency of numeric values through their quartiles. Quartiles are a method of splitting numeric values into four equal groups based on five key values: minimum, first quartile, median, third quartile, and maximum. To learn more about charts, see the Configure charts help topic.
New color ramps
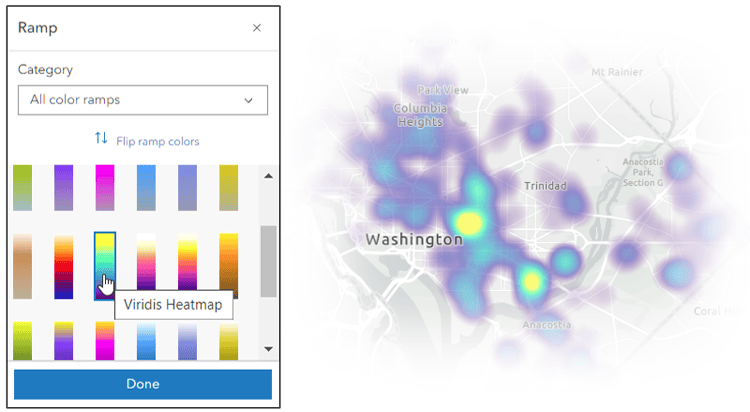
When configuring styles that use a color ramp, such as Heat Map, five new styles are available. These include Plasma, Viridis, Cividis, Magma, and Inferno, and are designed for enhanced data visualization and to provide support for those with color vision deficiencies.
Save group layers
Use group layers to organize related layers in your map. Once grouped, you can set exclusive visibility, showing only one specific layer without having to hide each of the other layers. You can now save group layers as items, enabling you to reuse group layers across your organization’s web maps. The group layer’s exclusive visibility and styling settings will also be saved in the item. Learn more about saving group layers as items.
Save imagery layers
You can duplicate and save an imagery layer or tiled imagery layer as a new item referencing the original layer.
Oriented imagery support
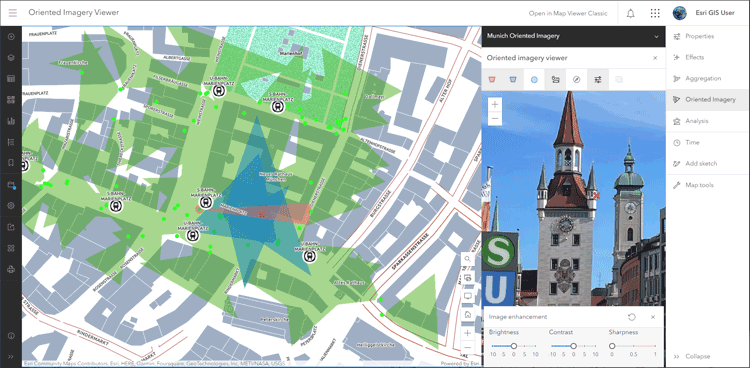
An oriented imagery layer is a type of feature layer for visualizing oriented imagery in the context of a map. Map Viewer now supports viewing and managing oriented imagery layers using the oriented imagery viewer. When added to the map, each point in an oriented imagery layer indicates the camera location where an image was acquired. For more information, see Introducing oriented imagery.
Configure time zones
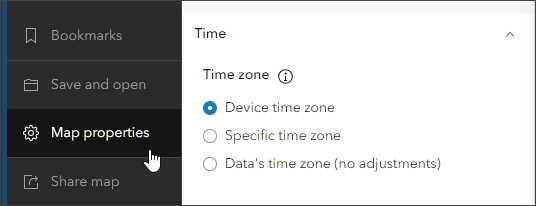
By default, the map displays the date and time based on the time zone of the device used to view the map. Map authors can now choose a specific time zone for their maps, ensuring all pop-ups and attribute data are consistently presented in the desired time zone rather than being influenced by the end user’s browser or mobile device.
Time zone options include using the device time zone, a specific time zone, or the data’s time zone. These can be set in Map properties on the Contents (dark) toolbar.
For more information, see Configure time settings and Working with time zones in Map Viewer.
Sketch layer improvements
You can add features to a map by creating a sketch layer. Use sketch features to symbolize something you want to show or highlight on the map. You can also add descriptive information that appears in pop-ups when the sketch feature is clicked.
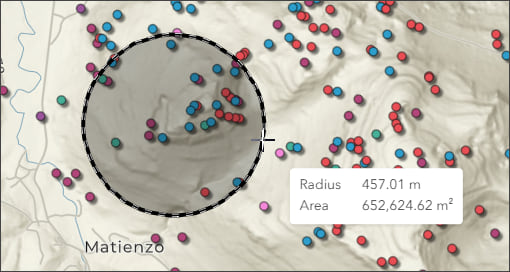
Sketch features can now be duplicated, preserving symbol properties and pop-ups. You can also enable tooltips to show distances and areas when adding new features.
Feature-to-feature editing
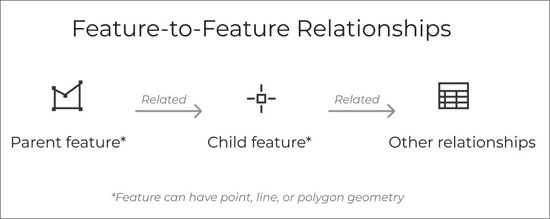
Feature-to-feature relationships link a parent to a child through a common matching field. To begin editing a Feature-to-feature relationship in ArcGIS Online, you must have a feature layer containing two or more related features. You can author relationships in ArcGIS Pro and publish to ArcGIS Online. Previously, only feature-to-table relationships were supported in ArcGIS Online.
For more information, see Now Featuring: Feature-to-feature editing in Map Viewer.

Analysis in Map Viewer
Map Viewer’s analysis tools allow you to quantify patterns and understand relationships in your data. Feature analysis tools are available to all members with appropriate privileges. Access to raster analysis tools requires appropriate privileges, plus an ArcGIS Image for ArcGIS Online license. For more information, see Licensing requirements for spatial analysis. For more information about ArcGIS Image, see What’s new in ArcGIS Image for ArcGIS Online (October 2023).
Crediting threshold analysis settings are now available for organizations with credit budgeting enabled. These settings allow you to enable a warning message when the estimated credit usage for an analysis run surpasses a specified threshold.
Find Point Clusters now creates charts as outputs for certain clustering method options. A distribution of membership probability chart is created as an output for Self-adjusting (HDBSCAN) and a reachability plot is created as an output for Multi-scale (OPTICS).
The following raster analysis tools are now available in Map Viewer:
- Detect Change Using Deep Learning uses a deep learning model to detect change between two raster layers.
- Locate Regions identifies the best regions in the input raster that meet specified size requirements and spatial constraints.
- Multidimensional Principal Components transforms the multidimensional imagery layers into a reduced number of components that account for the variance of the data so that spatial and temporal patterns can be readily identified.
- Nibble replaces the cells of a raster corresponding to a mask with the values of the nearest neighbors.
The following raster functions are now available in Map Viewer:
- Distance Accumulation calculates accumulated distance from each cell to input sources.
- Distance Allocation calculates distance allocation from each cell for sources.
- Focal Statistics calculates statistics on the cells within a neighborhood around each cell of an input raster. Several shapes of neighborhood are available.
- Interpolate Raster by Dimension interpolates a multidimensional raster at specified dimension values using adjacent slices.
- Least Cost Corridor calculates the sum of two accumulative cost distance rasters with the option to apply a threshold based on percentage or accumulative cost.
- Recast modifies the parameters of a function chain in a mosaic dataset or image service.
- Spectral Conversion applies a matrix to a multiband image.
- Transpose Bits unpacks the bits of the input pixel and maps them to specified bits in the output pixel.
Raster functions now support showing a preview of the result. Previews are available for all functions except global raster functions. Using previews you can modify the parameters before running the analysis, ensuring you obtain the expected result.
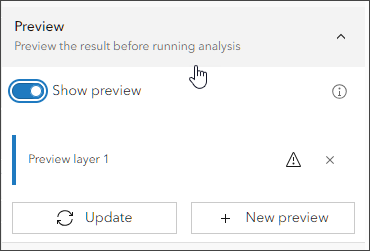
For more information, see Raster Function template.

Scene Viewer
Use Scene Viewer in ArcGIS Online for creating, viewing, and exploring 3D scenes. With this update, Scene Viewer has been enhanced with the following new capabilities and features.
Click Present at the top of Scene Viewer to enable presentation mode. In this mode, all but the essential navigation tools and a minimized slide ribbon are displayed, applying emphasis to the scene content.
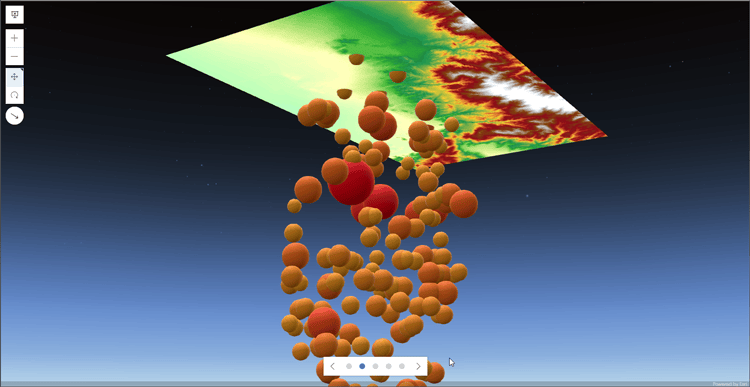
Scene layer pop-ups now support Arcade expressions and related records.
The user experience when using Scene Viewer on phones has been redesigned, providing a better compact experience.
For more information, see What’s new in Scene Viewer.

ArcGIS Instant Apps
ArcGIS Instant Apps is the next generation of focused web mapping applications, featuring a streamlined experience that lets you build apps quickly and easily using express or full setup modes. All Instant Apps templates can be found on the searchable Instant Apps home page.
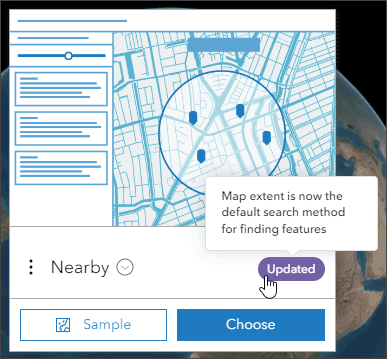
ArcGIS Instant Apps templates includes several new and updated apps. Hover over the badges in the app cards to learn more about new, updated, or beta apps.
Language switcher
With the new language switcher, you can allow users to choose a language from a drop-down list and view text in that language inside your web app. App authors can enter translated strings for user-defined text such as the app header, details, and information panel into one or more languages.
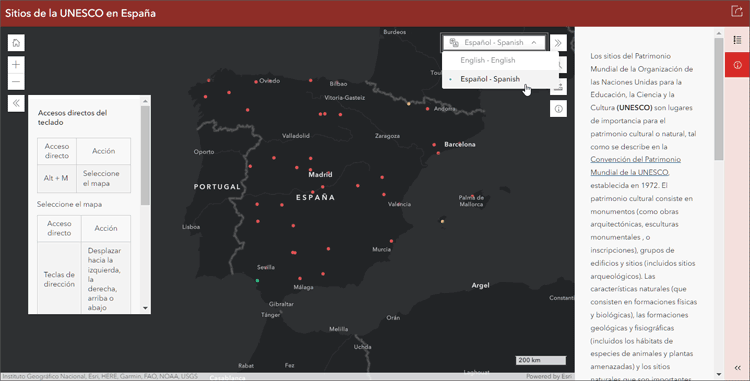
This enables language switching within a single app, eliminating the need to configure multiple apps to support different languages. In this update, the language switcher will be available in Media Map, Nearby, Zone Lookup, Interactive Legend, and Sidebar app templates.
New in Instant Apps
Atlas is now out of beta and in general availability. Atlas enables organizations to highlight a collection of curated maps and layers based on a point of interest, a geographic location, a theme, or a specific event.
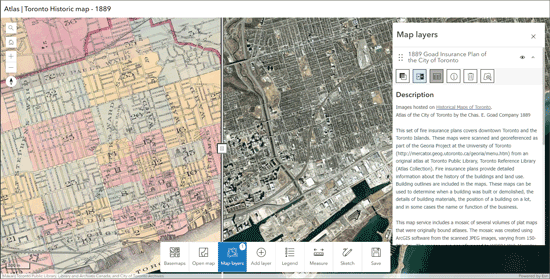
Atlas is an effective way to enable non-GIS users to make their own maps and explore your organization’s content. Users can easily discover and explore content, as well as share the maps they create via PDF or screenshots, or after signing in can save the map to their Content. Built-in tools help users explore the map by searching locations, switching between 2D and 3D, measuring distance and area, and using the enhanced sketch tools to add text and arrows to the map.
App authors can add maps and layers from a group, or directly choose from their content, including ArcGIS Living Atlas. Additional configuration options allow for customizing the toolbar.
Instant Apps updates
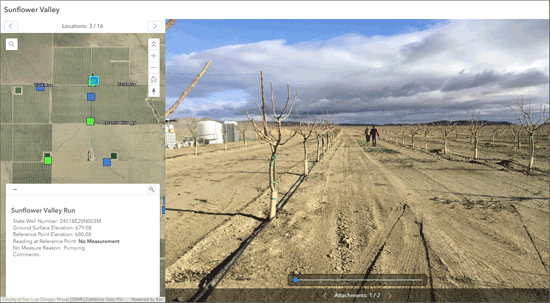
Attachment Viewer has been updated to include support for attribute filtering. Attachment Viewer is a good choice when you want users to view and explore images and other attachment types, such as videos and PDF files.
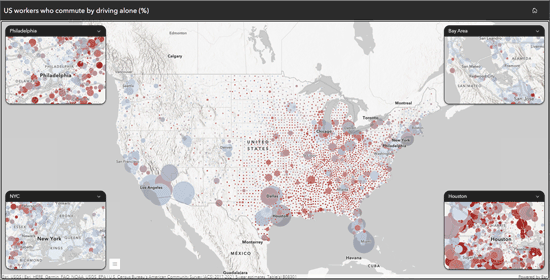
Insets is a good choice when you want to display noncontiguous geographic locations within a single app layout. You can choose from a list of predefined geographic layouts or customize the inset locations using bookmarks from the map or interactively placing custom insets. Additionally, you can apply theming and position the insets in the layout.
Insets has been improved with more predefined layouts, the ability to control layer visibility, an option to include a scalebar, and responsive inset sizing. In addition, new attribute filters help app authors control which features display inside specific inset windows.
Media Map has been improved with the ability to add filters based on attributes to narrow down the features displayed on the map. Media Map is a good choice when you want to keep the focus on your map with the addition of essential tools, such as navigation, time animation, and swipe.
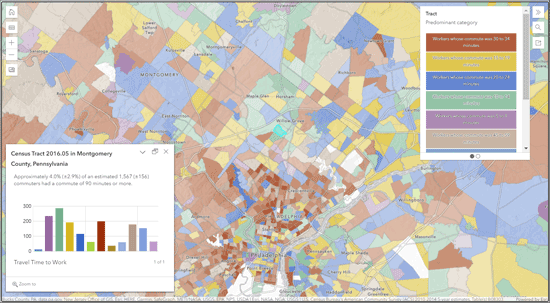
Nearby now uses the visible map extent as the default search area for finding features. Nearby is a good choice when you want viewers to find locations, such as stores or places of interest, within a specific radius.
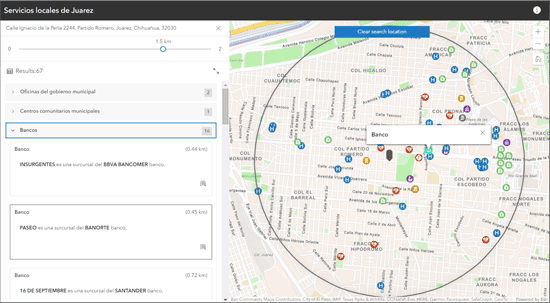
Instant Apps beta
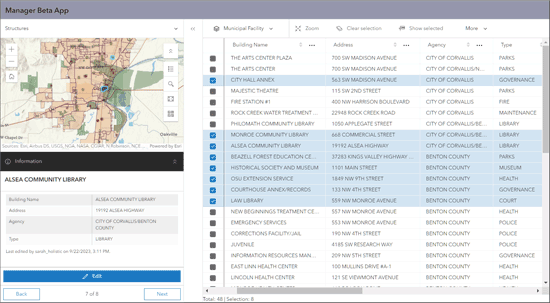
Manager offers the ability to add multiple maps and review and modify editable layers. After reviewing the data, editing tools can be used to edit attributes, attachments, and related records of features. Manager also includes a basic set of map exploration tools to navigate maps.
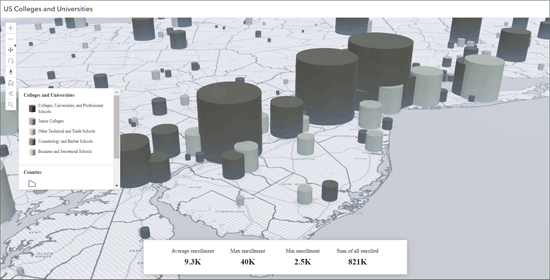
Observer is designed to provide users with the ability to explore the scene and learn more about the data. You can configure a scoreboard that will return statistics about features in the current visible extent. The template can also be configured with an optional basemap gallery and daylight tool.
For more information, see What’s new in Instant Apps (October 2023).

ArcGIS Dashboards
ArcGIS Dashboards enables users to convey information by presenting location-based analytics using intuitive and interactive data visualizations. Dashboards are used to help make decisions, visualize trends, monitor status in real time, and inform their communities. With this update, ArcGIS Dashboards includes several new capabilities and enhancements.
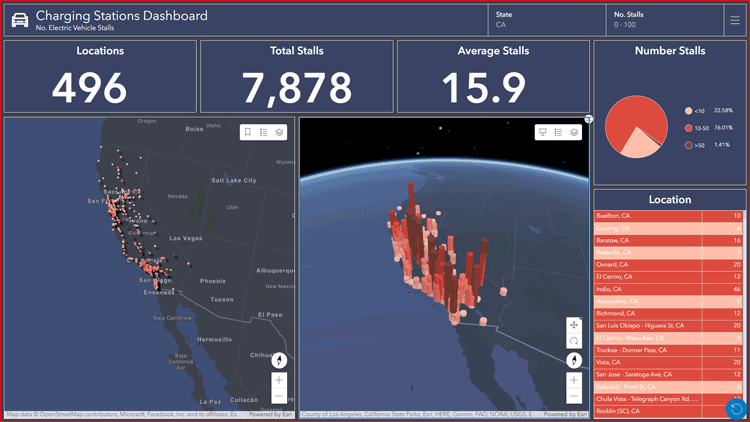
Web scene support
Dashboard map elements now support web scenes and 3D navigation tools. Layers in scenes can be used as data sources for other dashboard capabilities, such as visualization, selectors, and filtering using actions.
Improved mobile view actions
Action support has been extended for mobile dashboard views. Users can now configure various dashboard elements, such as lists, tables, and operational layers of maps, as the source of actions on the mobile view. This enhancement ensures a consistent and interactive experience across different devices. for more information, see Actions.
Category selectors
Category selectors allow users to filter a dashboard to a portion of the data by selecting one or more categories. You can now use the contains operator when configuring category selectors to support filtering to features that contain multiple categories—for example, multiple choice fields in Survey123.
Selecting features in maps
Additional map selection tools are now available. The lasso, circle, and line tools can be enabled to allow dashboard users to draw shapes on the map to make selections.
ArcGIS Living Atlas feature layers
When configuring elements for your dashboard, you can now use feature layers from ArcGIS Living Atlas of the World as stand-alone data sources.
Dashboard accessibility improvements
Dashboard accessibility is now enhanced for both keyboard navigation and screen readers. Users can now navigate within the table element using a keyboard to view all features and make selections. Additionally, assistive technologies like screen readers will benefit from more appropriate and relevant information when interacting with pie charts and gauge data visualizations.
For more information, see What’s new in ArcGIS Dashboards and Discover what’s new in ArcGIS Dashboards (October 2023).

ArcGIS Experience Builder
Use ArcGIS Experience Builder to build modern mapcentric or non-mapcentric web apps and webpages without writing code. Start building from scratch, or choose from an extensive library of templates that you can customize. You can add functionality to any template with widgets you can drag, drop, and configure. You can also add custom widgets, themes, and actions with low-code development to further extend your web app.
Analysis is a new widget available in ArcGIS Experience Builder. Analysis allows you to add spatial analysis and geoprocessing tools to any app, delivering full analysis capabilities to users.
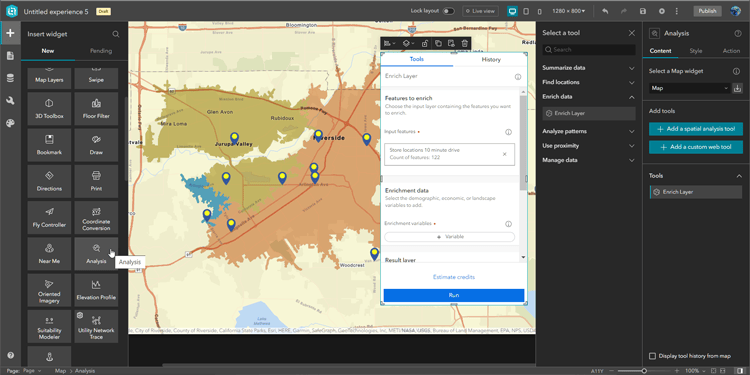
Other enhancements include the Edit widget supporting editing related tables, the Table widget allowing you to set filters at run time with the SQL expression builder, and a new Extent navigate tool for the Map widget.
For more information, see What’s new in Experience Builder.

ArcGIS Notebooks
ArcGIS Notebooks provide a Jupyter notebook experience optimized for spatial analysis. Combine spatial analysis algorithms with open-source Python libraries to build precise spatial data science models. Reduce time spent managing dependencies across data science ecosystems, and increase cross-team collaboration and transparency.
Administrators and members with the Schedule notebooks privilege can now manage their scheduled notebook tasks from the Notebooks home page and create snapshot previews.

Data management
New date and time fields
New field types will be added to ArcGIS Online to store date and time in a variety of formats. You can now select a field type that can accommodate data without a timestamp, or data that is collected across multiple time zones. Read the blog for more information.
Metadata editor
A new editor for metadata is available that improves the experience for editing and viewing metadata. Create and maintain standards-based metadata with a simple creation and updating experience. The new editor is the default option when editing metadata, but item owners still have the option to use the metadata editor classic at this release. For more information, see Metadata editor out of beta.
Content categories
The number of categories that can be used for content and groups has now been increased to 900 categories. Content categories can be used to organize content across the organization and content within groups. Content categories make it easier to discover content and you can configure custom categories or use standard category sets from ArcGIS, the International Organization for Standardization (ISO), or INSPIRE as a starting point.

Data Pipelines (Beta)
Data Pipelines is a new data integration and engineering application in ArcGIS Online. With Data Pipelines, Creators and GIS Professionals can connect to a variety of data sources, including external cloud databases and cloud storage, perform data preparation operations, and create hosted feature layers that can be used across the ArcGIS system. Data pipelines can be saved and shared within the organization and run again later.
Since its initial beta introduction with the June 2023 update, Data Pipelines has evolved with new capabilities and enhancements.
Scheduling
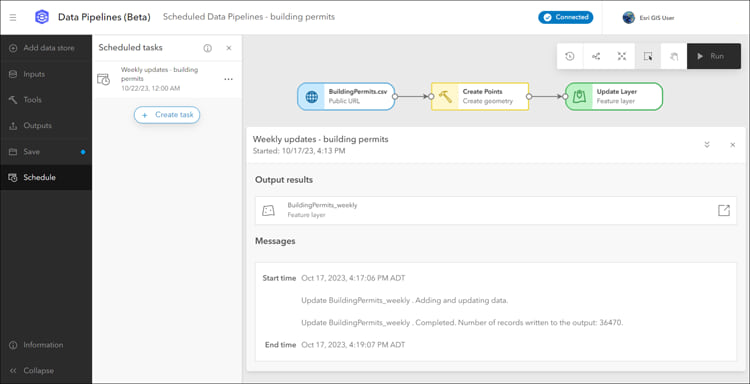
Users can now schedule tasks, allowing for data pipelines to be run at a regular intervals, keeping your feature layers and tables up to date as the source data changes. Users will be able to edit scheduled tasks to modify their recurrence and view task runs to review details about the run such as the status, output results, messages, and run times.
Schema configuration
Another improvement is the schema configuration for datasets in CSV or delimited formats. Users can define the schema directly in the input dataset pane, eliminating the need for separate tools. This includes options to include or exclude fields, modify field names, and modify field types.
Data Pipelines can be opened from the app launcher. Follow a tutorial to learn how to create your first data pipeline. For more information, see:
- Introduction to Data Pipelines
- Introducing Data Pipelines in ArcGIS Online
- What’s new in data pipelines (October 2023)

More information
For more information and additional details about this update, see the What’s new help topic or view all posts related to this release. You can also watch an introductory video to see new capabilities in action.
Visit the ArcGIS Online Esri Community to ask questions, view blogs, learn from peers, and submit your ideas for future enhancements.


Commenting is not enabled for this article.