The frequency and severity of wildfires around the world are rising, making the tracking and assessment of wildfire damage a critical issue. However, monitoring these wildfires is made intuitive and seamless with ArcGIS Online.
I was initially inspired after reading through the excellent blog Map in a Minute: Map smoke from Canadian wildfires using ArcGIS Online and ArcGIS Living Atlas and I wanted to visualize the damage for one of those fires using imagery in ArcGIS Online.
This blog will specifically examine the wildfire scenario using satellite imagery. In this case, the frequent capture and coverage of satellite imagery is very useful in visualizing wildfires as it offers the most current view of the landscape.
While the previously mentioned blog focuses on the smoke created from the fires, I wanted to go a step further and create a map that shows the impact of a specific fire in a time series to a specific location. For this to work, I needed to locate a fire and then acquire Landsat imagery that could show the before, during, and after the fire.
This blog is Part 1 of 5 – collectively, this series will analyze one specific wildfire incident and will cover the following topics:
- Create multidimensional imagery
- Host multidimensional imagery layer
- Review wildfire in time series
- Host Landsat imagery layers
- Assess damage
After reading this blog, you will be able to create a multidimensional image using satellite imagery. Let’s get started.
Location
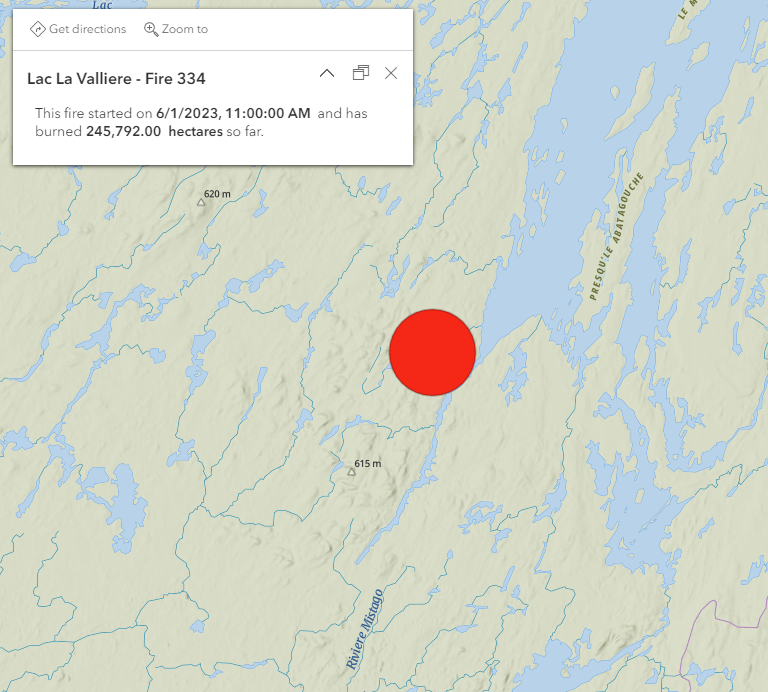
For this study, I chose one of the areas identified as a wildfire hot zone. After some research, the location is around Lac La Valliere near Mistissini, Quebec. In the area southwest of the lake, there is a wildfire that started around June 1, 2023.
Software required
ArcGIS Pro (version 3.1.2 is used during creation)
Data
The imagery data for this process is three Landsat imagery layers that will be used to show the area before the fire, while the fire is active, and the damaged area. The Landsat images were downloaded from Earth Explorer by USGS. Once the desired scene was located, the key was finding the ideal imagery to show the wildfire as it happens. For this project, I chose two Landsat 8 images and one Landsat 9 image. However, since the three images have common raster bands with similar wavelengths, I am able to combine them and view the wildfire in action.
For your convenience, the three Landsat images are provided here to download.
Once you have downloaded them, unzip them in a folder.
Workflow
1. Open ArcGIS Pro with at least the Standard license to be able to create the mosaic dataset and use the necessary geoprocessing tools.
2. Create a new project or start without a template.
3. In the Catalog pane, find a folder location on your local drive and right-click it, select New, and choose File Geodatabase.
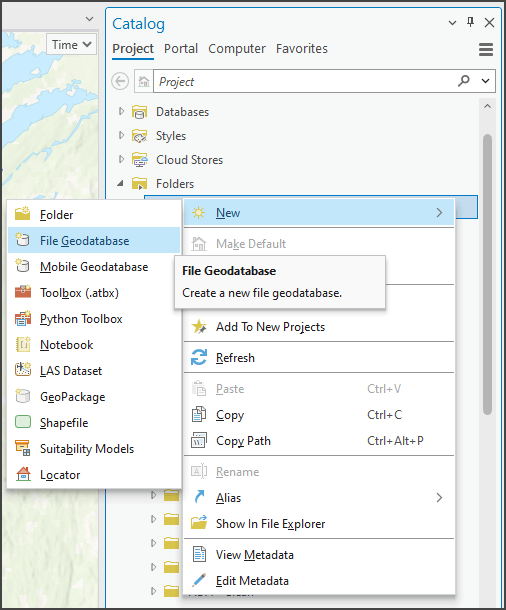
4. Type in a name for the file geodatabase, I used CanadaFireMD.
If you prefer, you could use a file geodatabase of your own if you do not want to create a new one.
5. Right-click the CanadaFireMD from the Catalog pane, select New, and choose Mosaic Dataset.
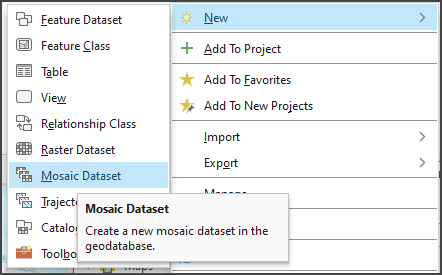
The Create Mosaic Dataset tool will open, and the Output Location will be the file geodatabase that you selected.
6. In the Create Mosaic Dataset tool interface, type in LacLaValliere_Fire for the Mosaic Dataset Name, and choose Landsat OLI for Product Definition.
7. Click Run to create the mosaic dataset.
The mosaic dataset will be created and added to the map.
8. In Catalog pane, expand the CanadaFireMD geodatabase, right-click LacLaValliere_Fire mosaic dataset, and select Add Rasters to open the Add Rasters To Mosaic Dataset tool.
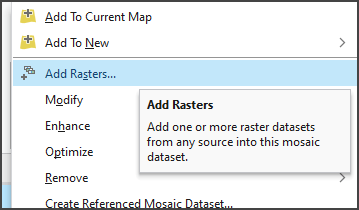
9. In the Add Rasters To Mosaic Dataset, confirm the Raster Type is Landsat 8 and the Processing Template is Multispectral.
10. For Input Data, select Folder and then click the Browse button and navigate to the folder location of the CanadaFire folder.
11. Click Run to add both of the Landsat 8 images to the mosaic dataset. In the CanadaFire folder, there are three folders containing Landsat images. There is one folder for each Landsat scene.
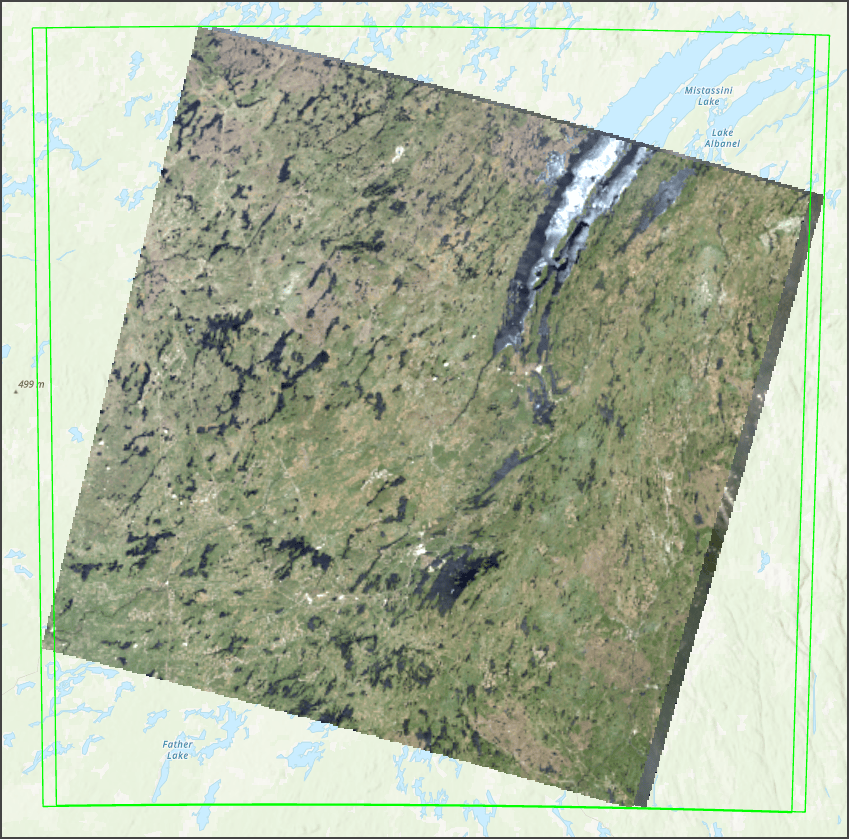
12. In the Add Rasters to Mosaic Dataset tool change the Raster Type to Landsat 9 and run the tool again. The CanadaFire folder should still be selected as the input, since you changed the raster type, only the Landsat 9 scene will be added and the Landsat 8 scenes will not be added at this time.
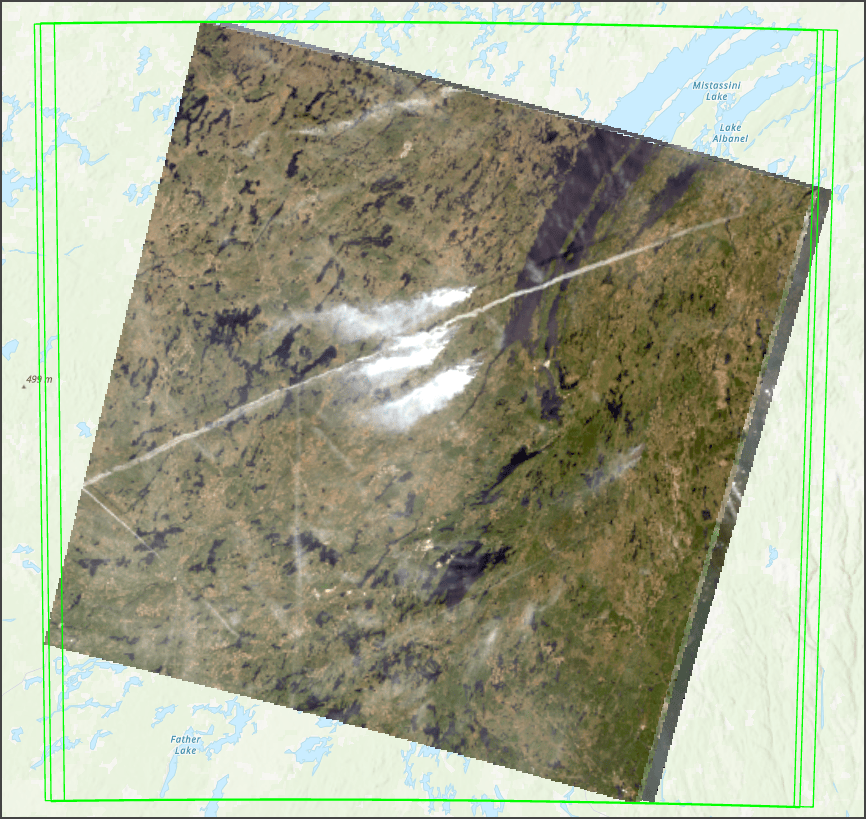
Now that all three Landsat images have been added to the mosaic dataset, you’ll likely notice that the green bounding box indicating the spatial extent of the imagery is outside the visible pixels of the image. In the next step, you will rebuild the footprints to clean up the display of the image. This is a vital step when creating imagery layers to avoid creating NoData values when you do not need them.
13. Open the Geoprocessing pane and search for the Build Footprints tool.
14. In the tool interface, select the LacLaValliere_Fire mosaic dataset and Run the tool.
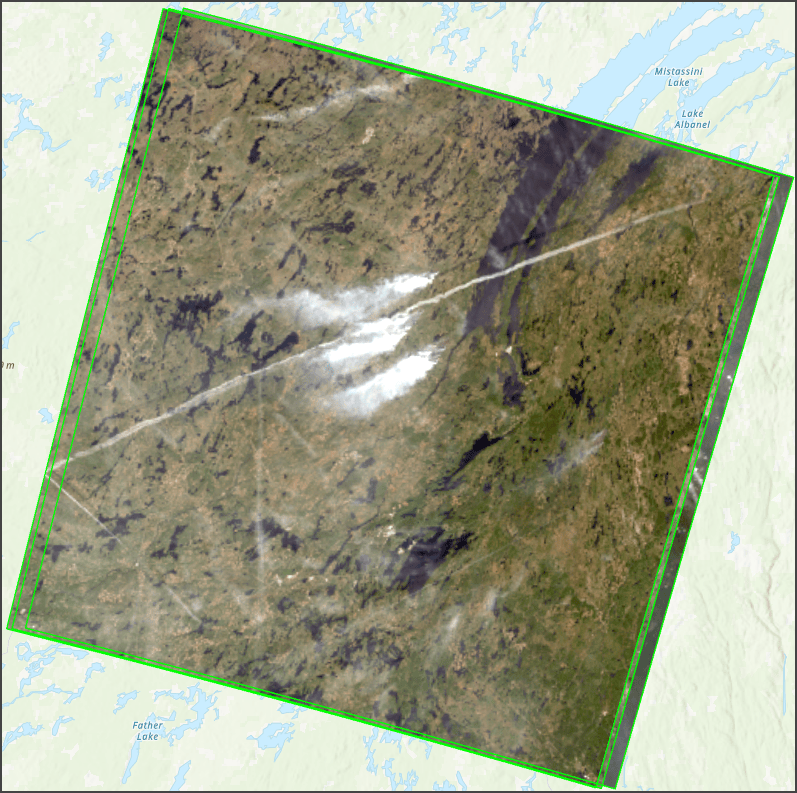
Now that the footprint has been rebuilt, you are ready for the next step to add the field you will need for the multidimensional process.
15. In the Contents pane, right-click the Footprint, and select the Attribute table to open the table.
The attribute table contains all three of the Landsat images and information about each of the input images. You will use some of this information to create a multidimensional image, but you need to add one field.
16. Click the Add Field button and add a new field.

17. In the Fields pane, type ProcTemplate for the Field Name, for Alias type Processing Template, and for Data Type choose Text.
18. At the ribbon at the top, click Save to save the edits, and close the Fields pane.

19. In the Footprint attribute table, scroll to the right, find the Processing Template field, and type Multispectral in each of the <Null> fields.

20. In the Geoprocessing pane, find the Build Multidimensional Info tool, and at the top of the tool interface, click Save to save the edits you made.

21. In the Build Multidimensional Info tool, enter the following parameters:
- Mosaic Dataset: LacLaValliere_Fire
- Variable Field: ProcTemplate
- Variable Info: Multispectral
- Dimension Fields: AcquisitionDate
22. Click Run to add the Multidimensional information to the mosaic dataset.
The mosaic dataset can sometimes suddenly change colors, this is normal. Simply remove the mosaic dataset and re-add it to the map.
23. If necessary, remove the mosaic dataset from the map and re-add it.
Now that you have a mosaic dataset with the necessary multidimensional information, you are ready to create the multidimensional image.
24. Open the Geoprocessing pane, locate the Copy Raster tool, and open the tool.
25. In the tool interface, select the LacLaValliere_Fire for Input Raster, click the browse button for Output Raster Dataset, and choose a good location and type LacLaValliere_Fire_MD.crf for the name.
The .crf file extension is necessary to create a multidimensional image.
26. Confirm that Process as Multidimensional is checked and Run the tool.
The output will be added directly to the map, but the colors will be washed out due to missing statistics on the image.
27. Remove the new image and re-add it to the map, the new image will have the correct colors and you will notice that the Multidimensional tab has been added to the ribbon.
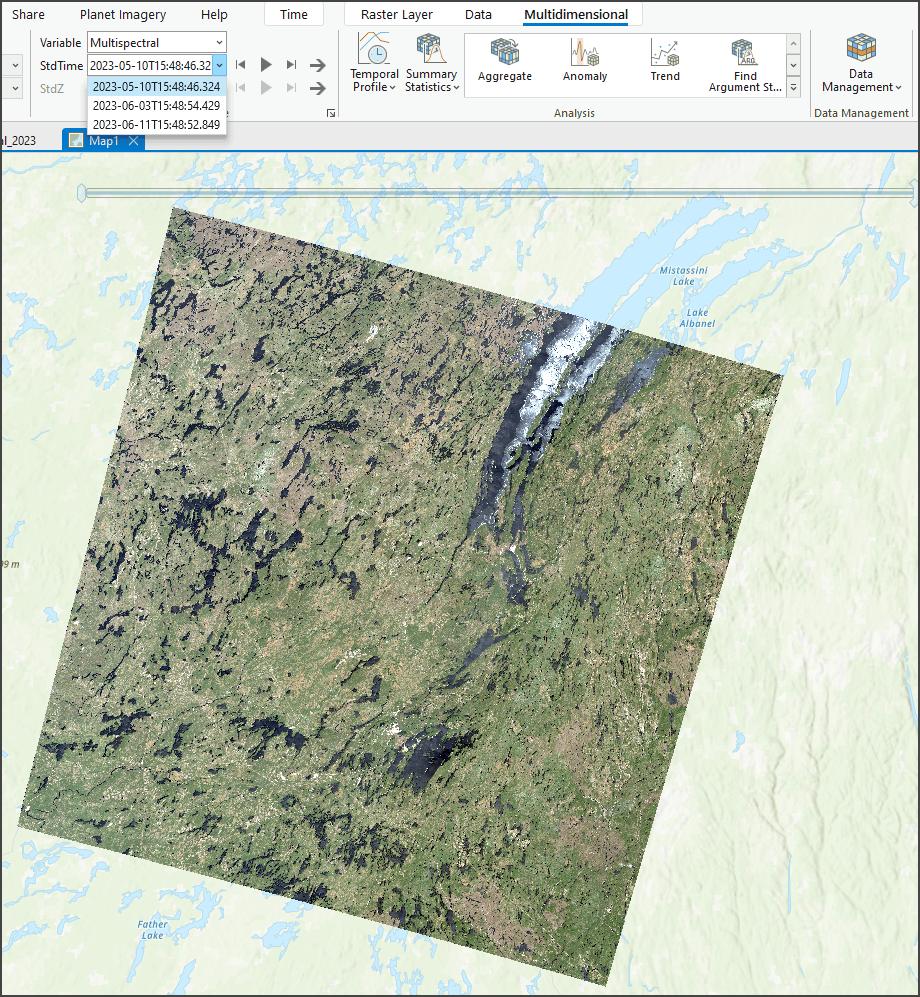
This multidimensional image can be used as any other multidimensional imagery layer in ArcGIS Pro and can also be hosted in ArcGIS Image for ArcGIS Online. Simply create an imagery layer as a Single Raster, and for input choose the .crf file.
Here is an example of the resulting imagery layer if you were to host it in ArcGIS Online.
Ready to take the next step?
In Part 1, you learned to create a multidimensional image based on Landsat imagery. This imagery layer will be used in subsequent steps of this series to visualize and analyze wildfire damage. I hope these steps helped guide you in creating multidimensional data and I encourage you to read the next blog in this series to complete the assessment of wildfire damage.
Go to Part 2: Host multidimensional imagery layer



Article Discussion: