With the June 2023 release of Business Analyst Web App, we introduced a new and more powerful color-coded maps capability. New features — such as the interactive results pane, improved filtering, and a more intuitive user interface — have added exciting capabilities that streamline working with attributes and user-defined sites.
Geography and level of detail settings
One of the most powerful enhancements is the new Geography section of the workflow pane, which is used to define the analysis extent and level of detail used in color-coded maps (CCM). The Analysis extent menu controls what geographic area is displayed in the map, while the Level of detail menu controls which geographic hierarchies or areas are used in the map display. The two work in parallel so you can clip the display to focus on a particular area or site, such as the State of Goiás in Brazil shown below.
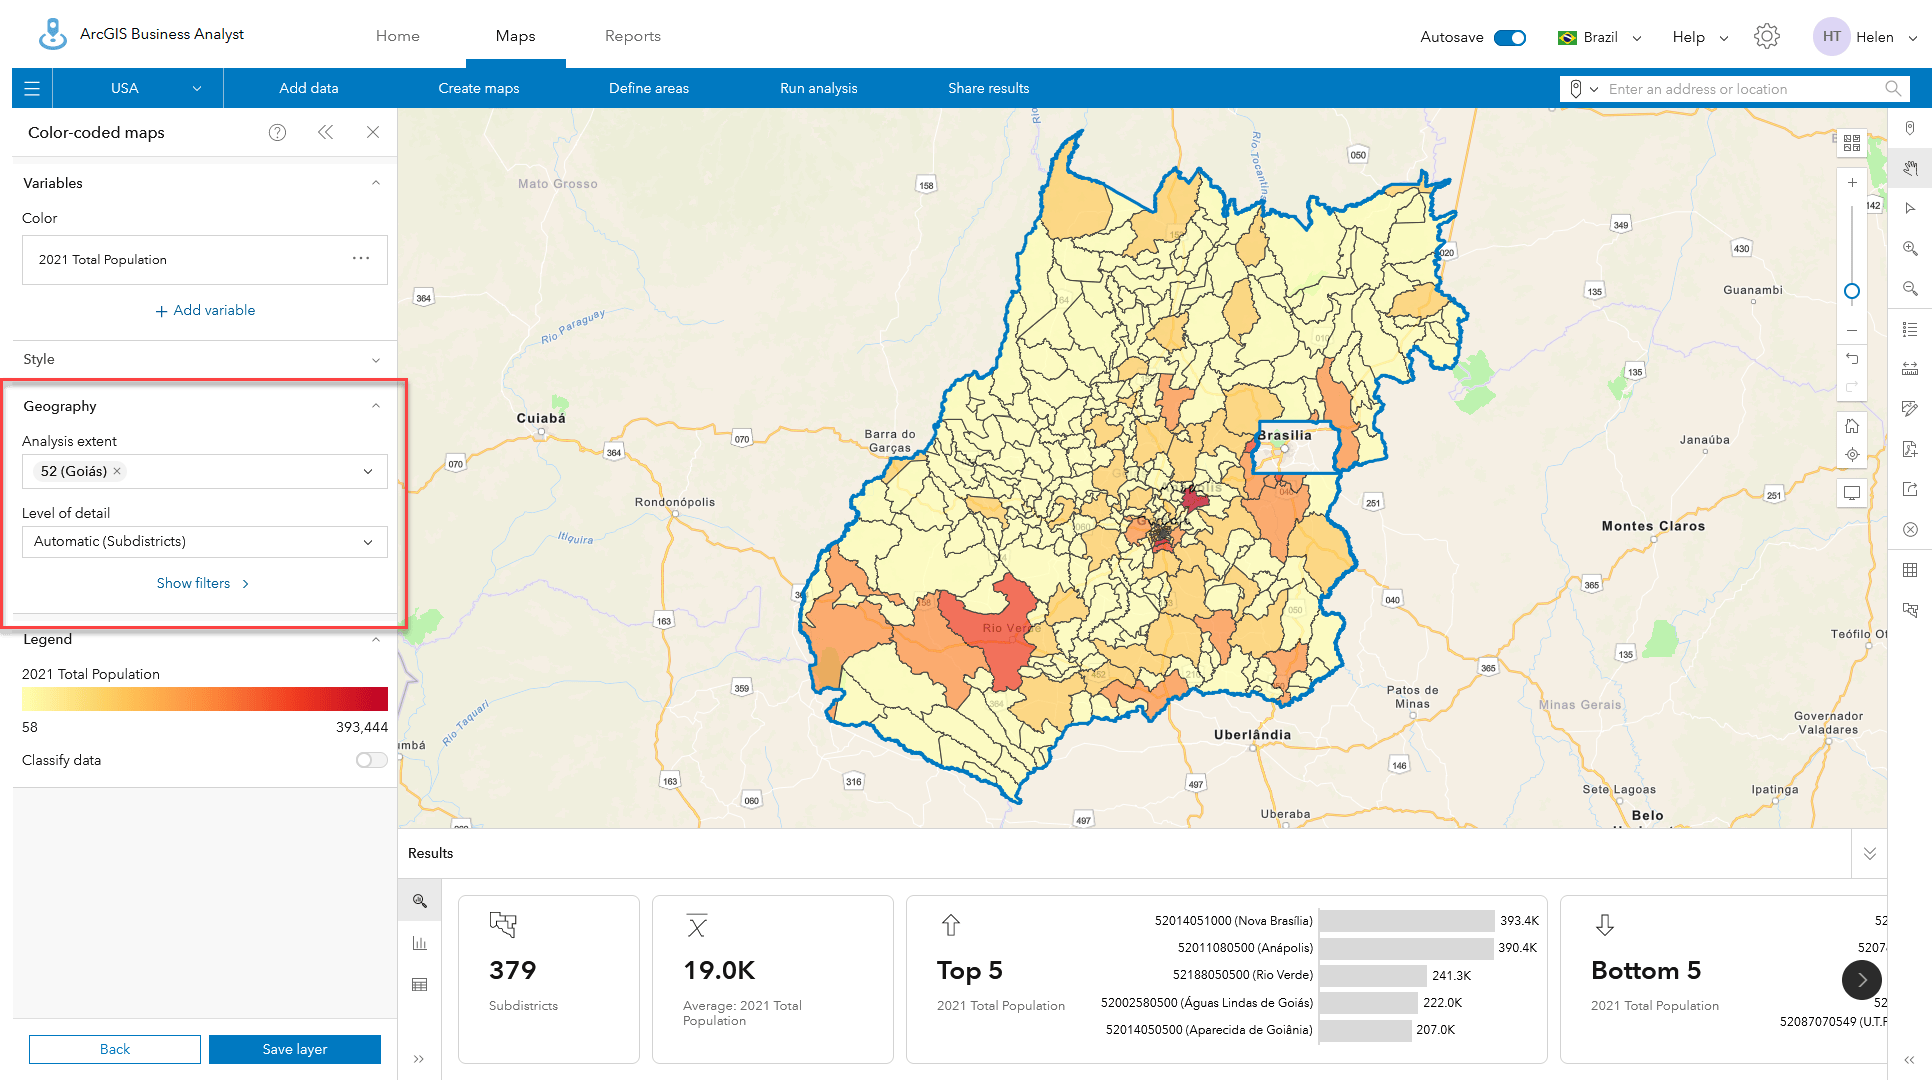
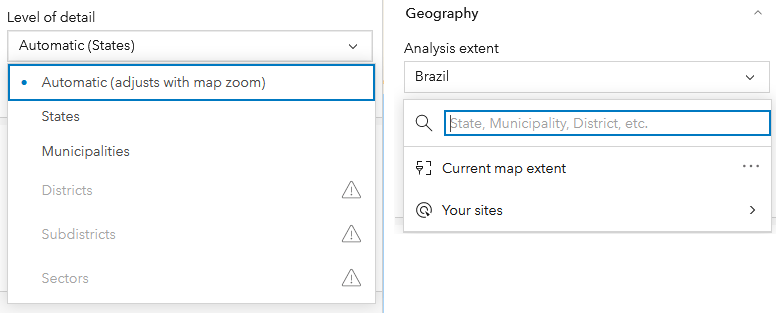
By default, color-coded maps automatically selects and locks, the best geographic level of detail to display, based on the current map extent and map scale. You can use the drop-down menu to select other geographies. For Brazil this includes States, Municipalities, Districts, Subdistricts and Sectors. Once selected, CCM uses the specified level of detail even when you change scales.
Independent of how you set the level of detail, some geographies may not be available at different map scales or when using specific analysis extents. This is because we wanted to maximize display performance and minimize the volume of data sent over the internet. Color-coded maps limits the display of areas within the map extent to a maximum of 10,000 individual polygons. With some combinations of analysis extent and level of detail, CCM will not display the data you expect. When this occurs a triangular warning is shown in both the Level of detail and Results pane.
For example, when using the whole of Brazil as the analysis extent as shown below, it is not possible to display Sector-level geographies, of which there are 315,788. The Sector-level geography is greyed out and shown with a warning icon telling you to choose another analysis extent.
Zooming in, using Current map extent, or using individual/multiple areas from Your sites will normally unlock new levels of detail and allow you to map areas at the finest resolution.
Overcoming the geographic level of detail limits
In the example below, we are showing a small map extent in Brasilia at the Sectors zoom level, but because there are more than 10,000 features in the State of Goiás (our analysis extent) it is not possible to see demographics at the Sector level because the CCM display rules are locked to the Subdistrict level.
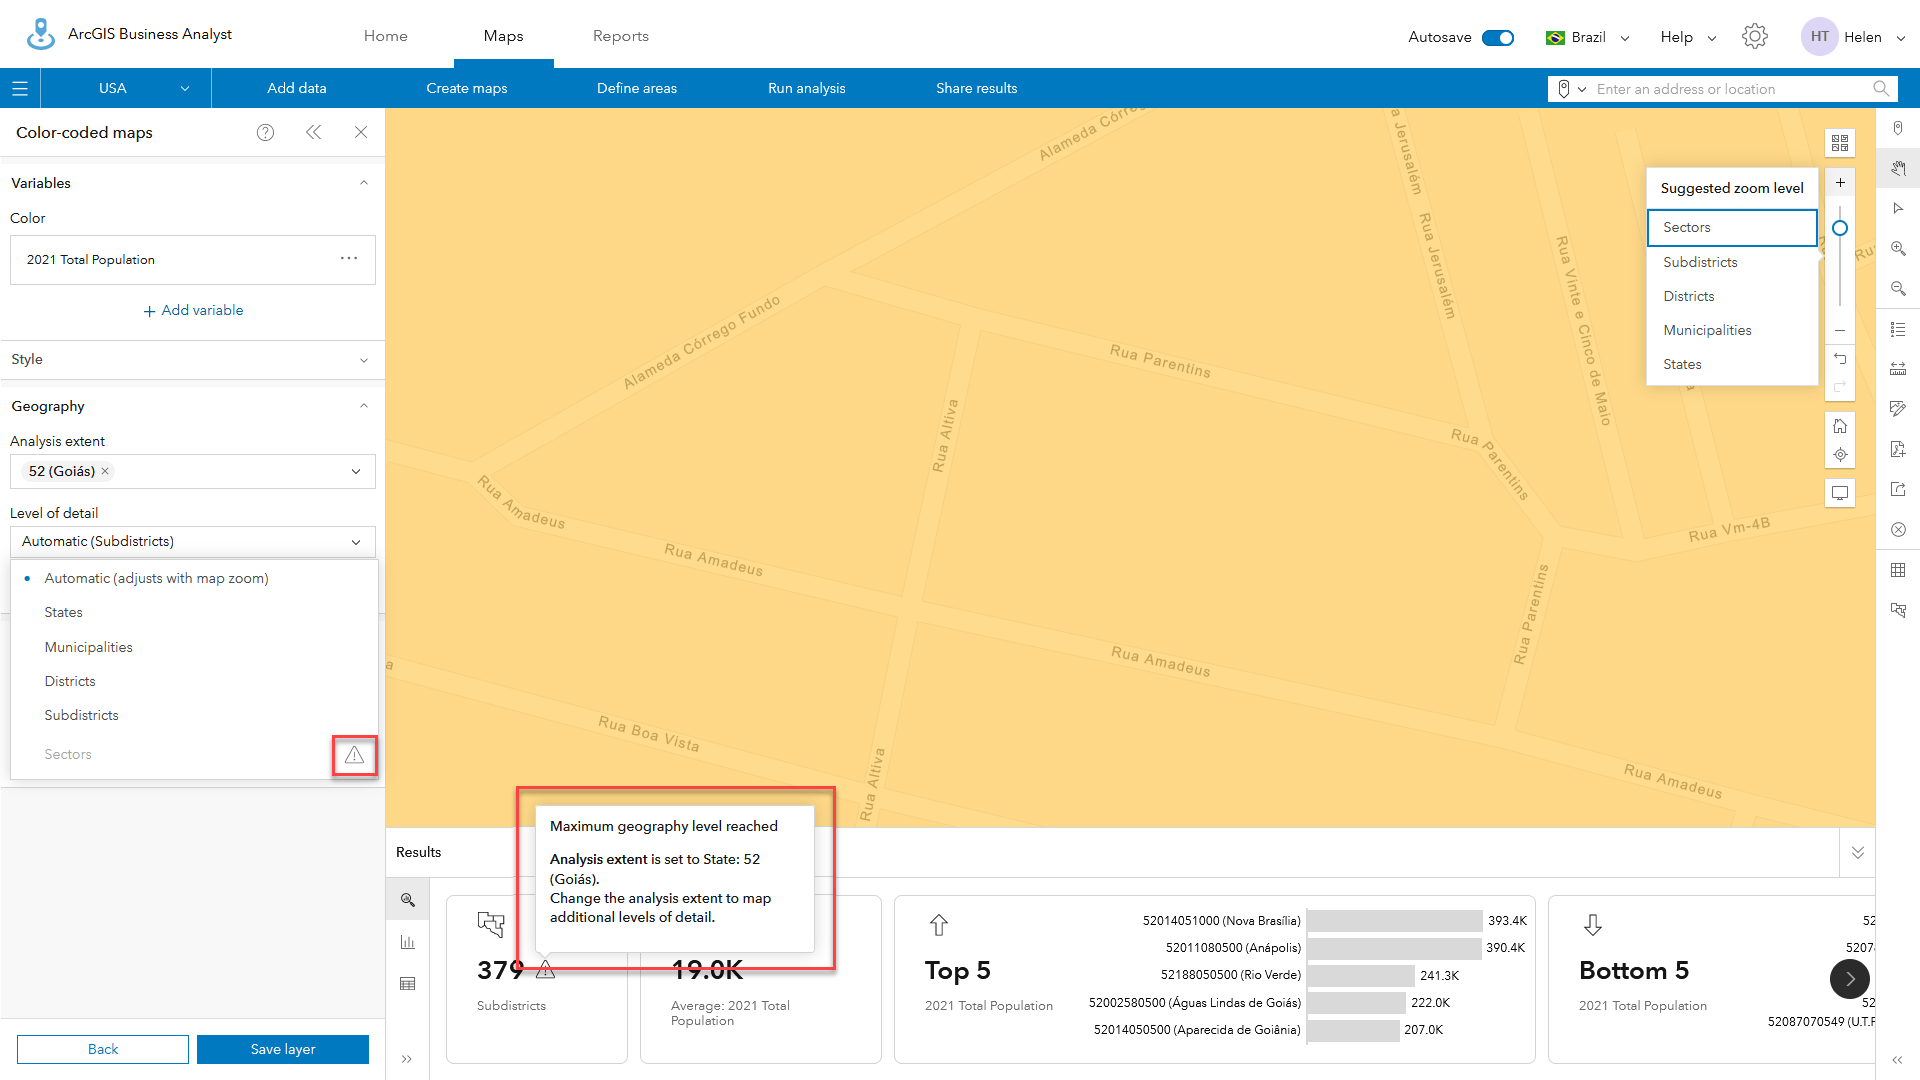
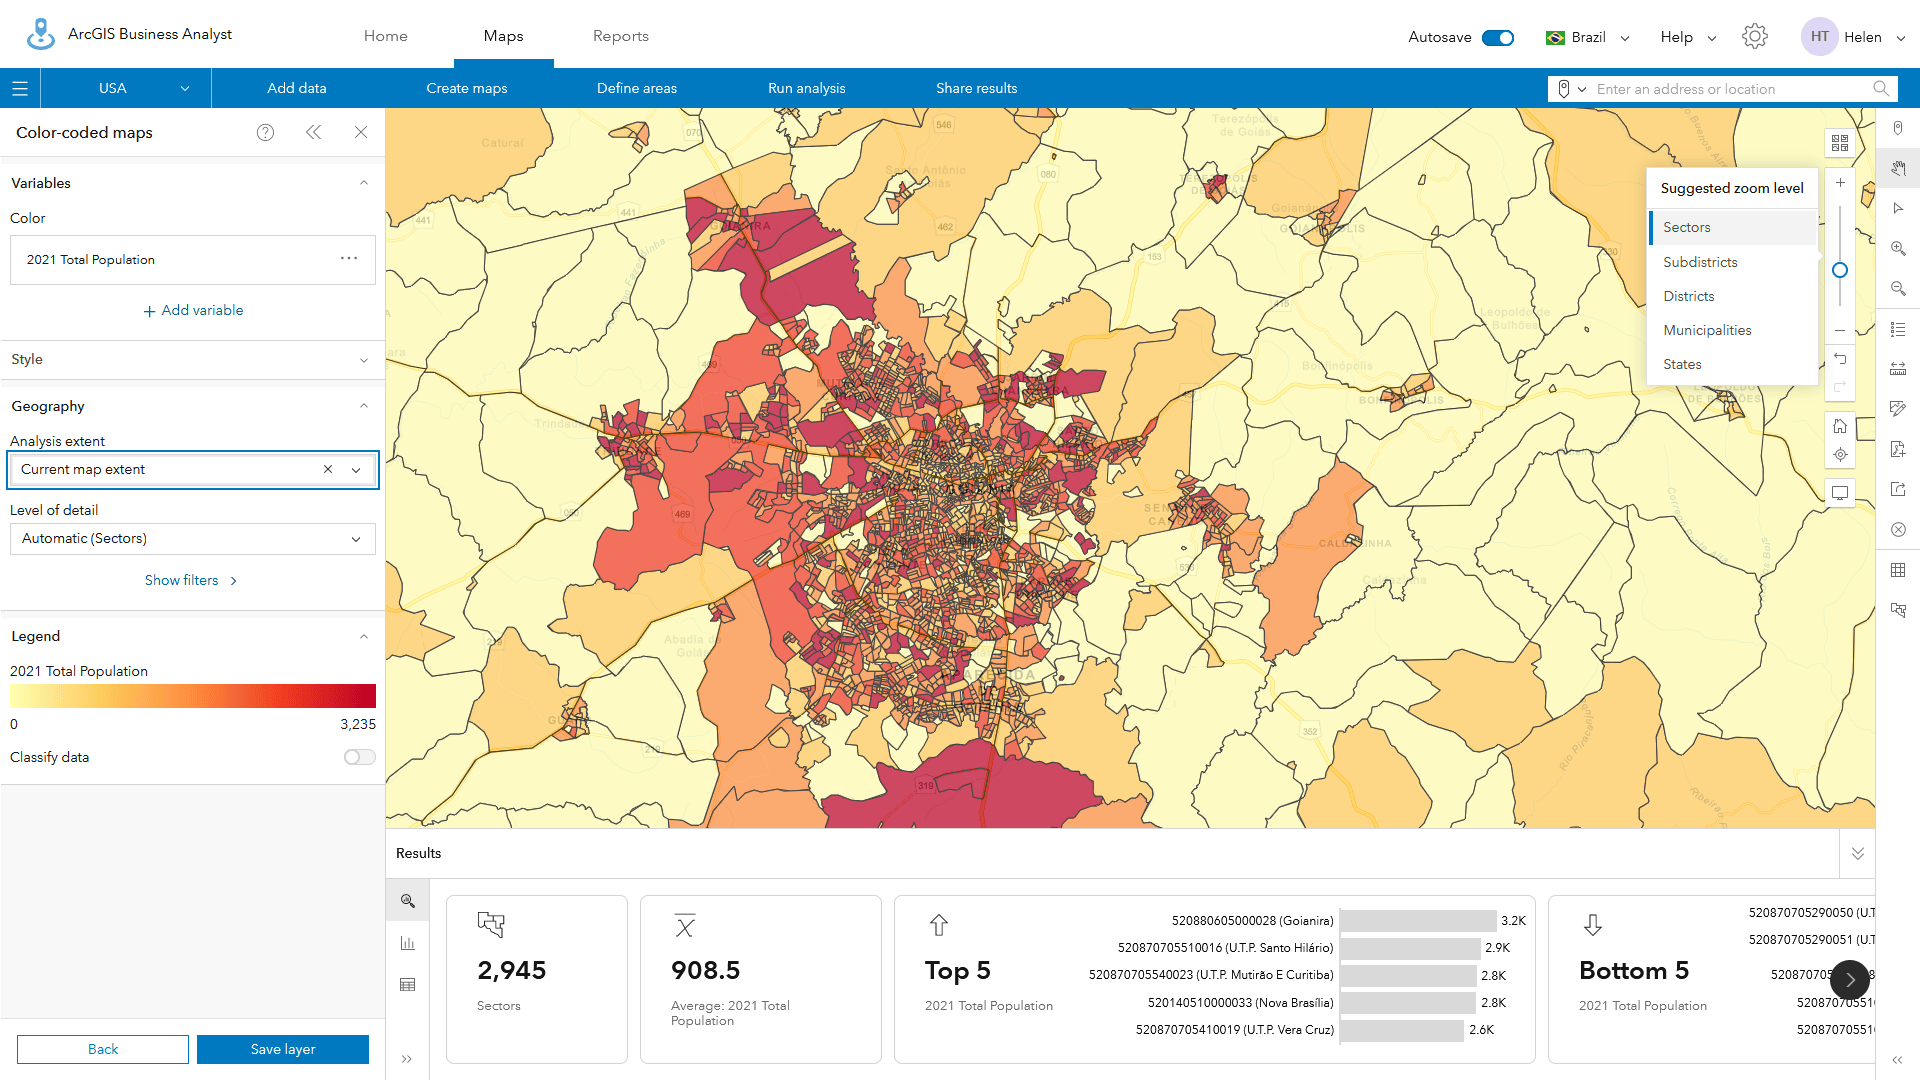
This is because, as explained in the warning messages, the use of Goiás as the analysis extent means that there are more than 10,000 areas that may be drawn and cached in the display. Zooming out will not override the display lock. Instead, changing the analysis extent control to Current map extent or another geographic area, such as the District of Brasilia, will allow you to display Sector-level demographics as shown below.
Using sites to control the analysis extent
One of the changes in the June 2023 release was a revision to how the Select geography workflow operates. Previously, if you selected a group of geographies in the Define areas > Select geography pane, the default was to combine the selected geographies into one site. Now the default is to add each area as an individual site.
This update was made based on user feedback. The majority of users wanted to be able to easily recreate sites that are a combination of areas such as postal boundaries, states, districts, or municipalities. By combining them into a single geography, there was no way to easily track and revise the site when the underlying geographies changed. This is especially true of postal geographies, which change frequently.
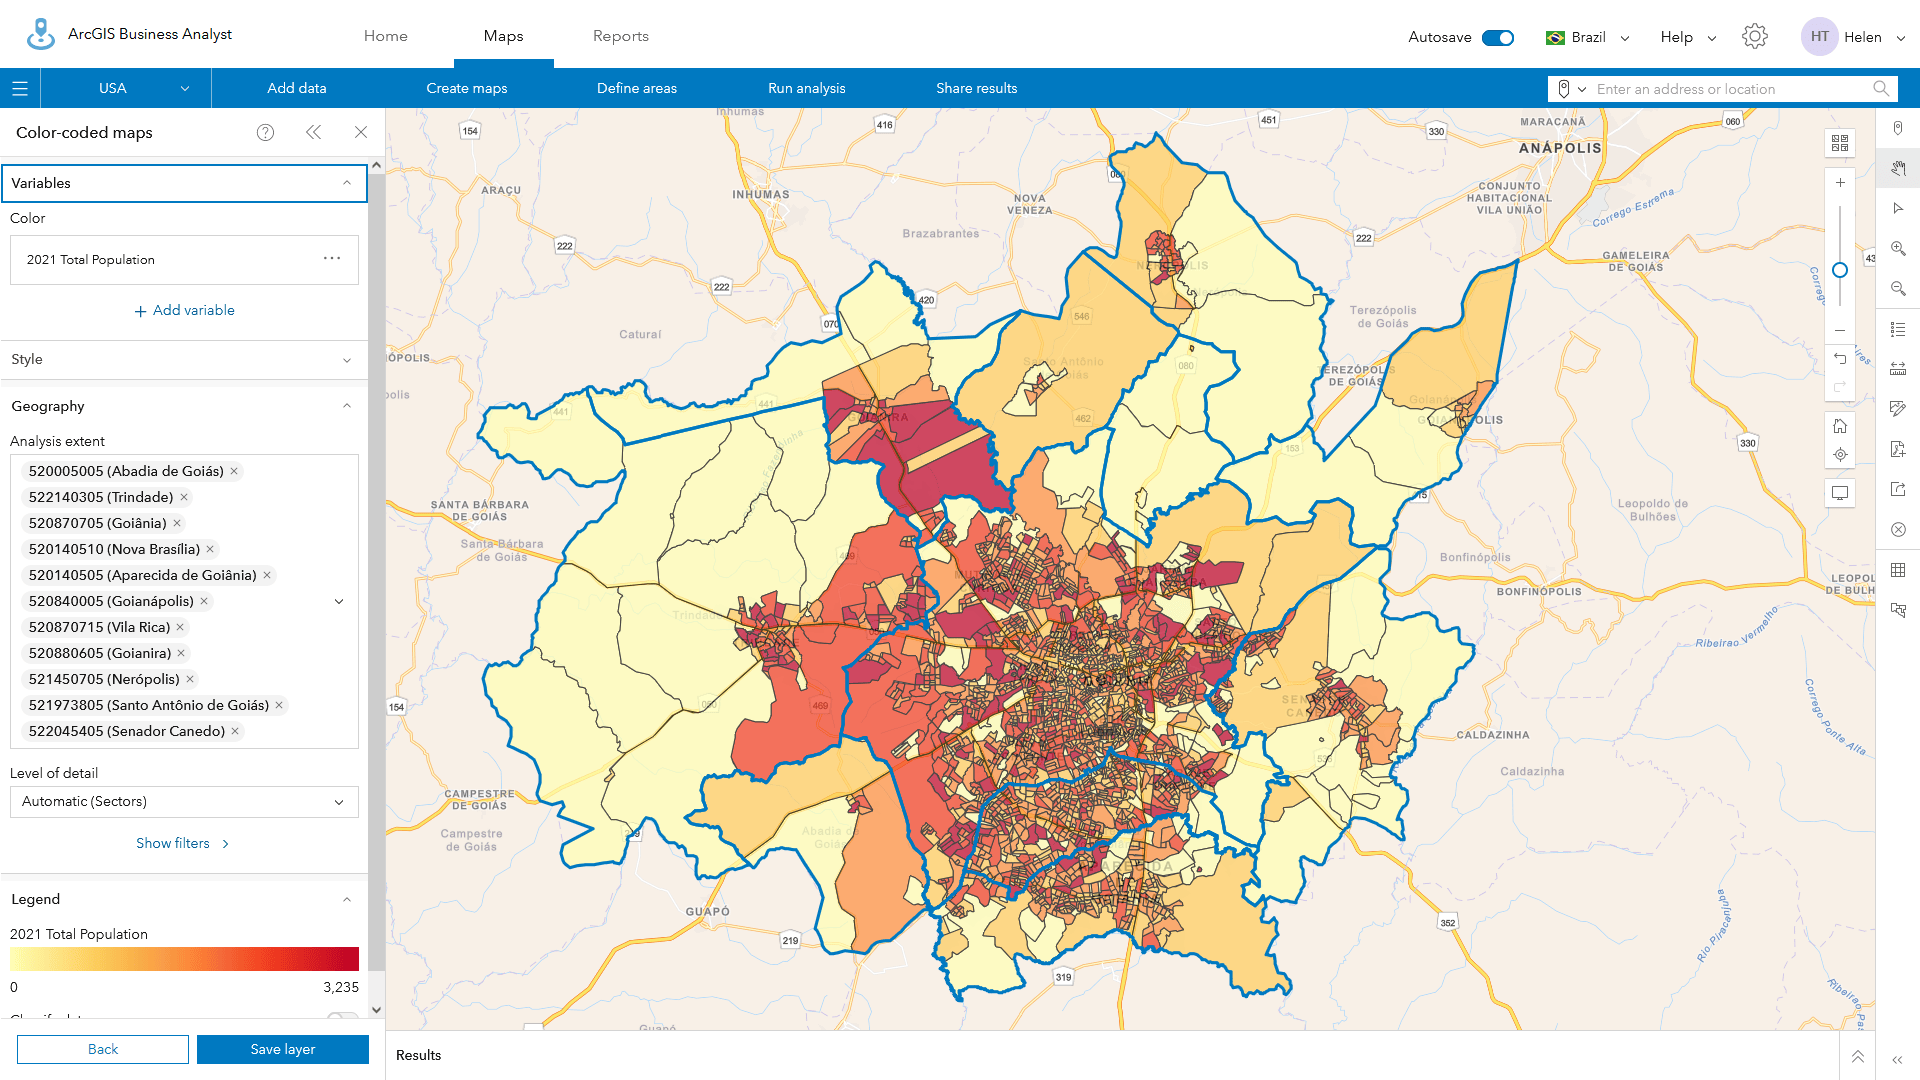
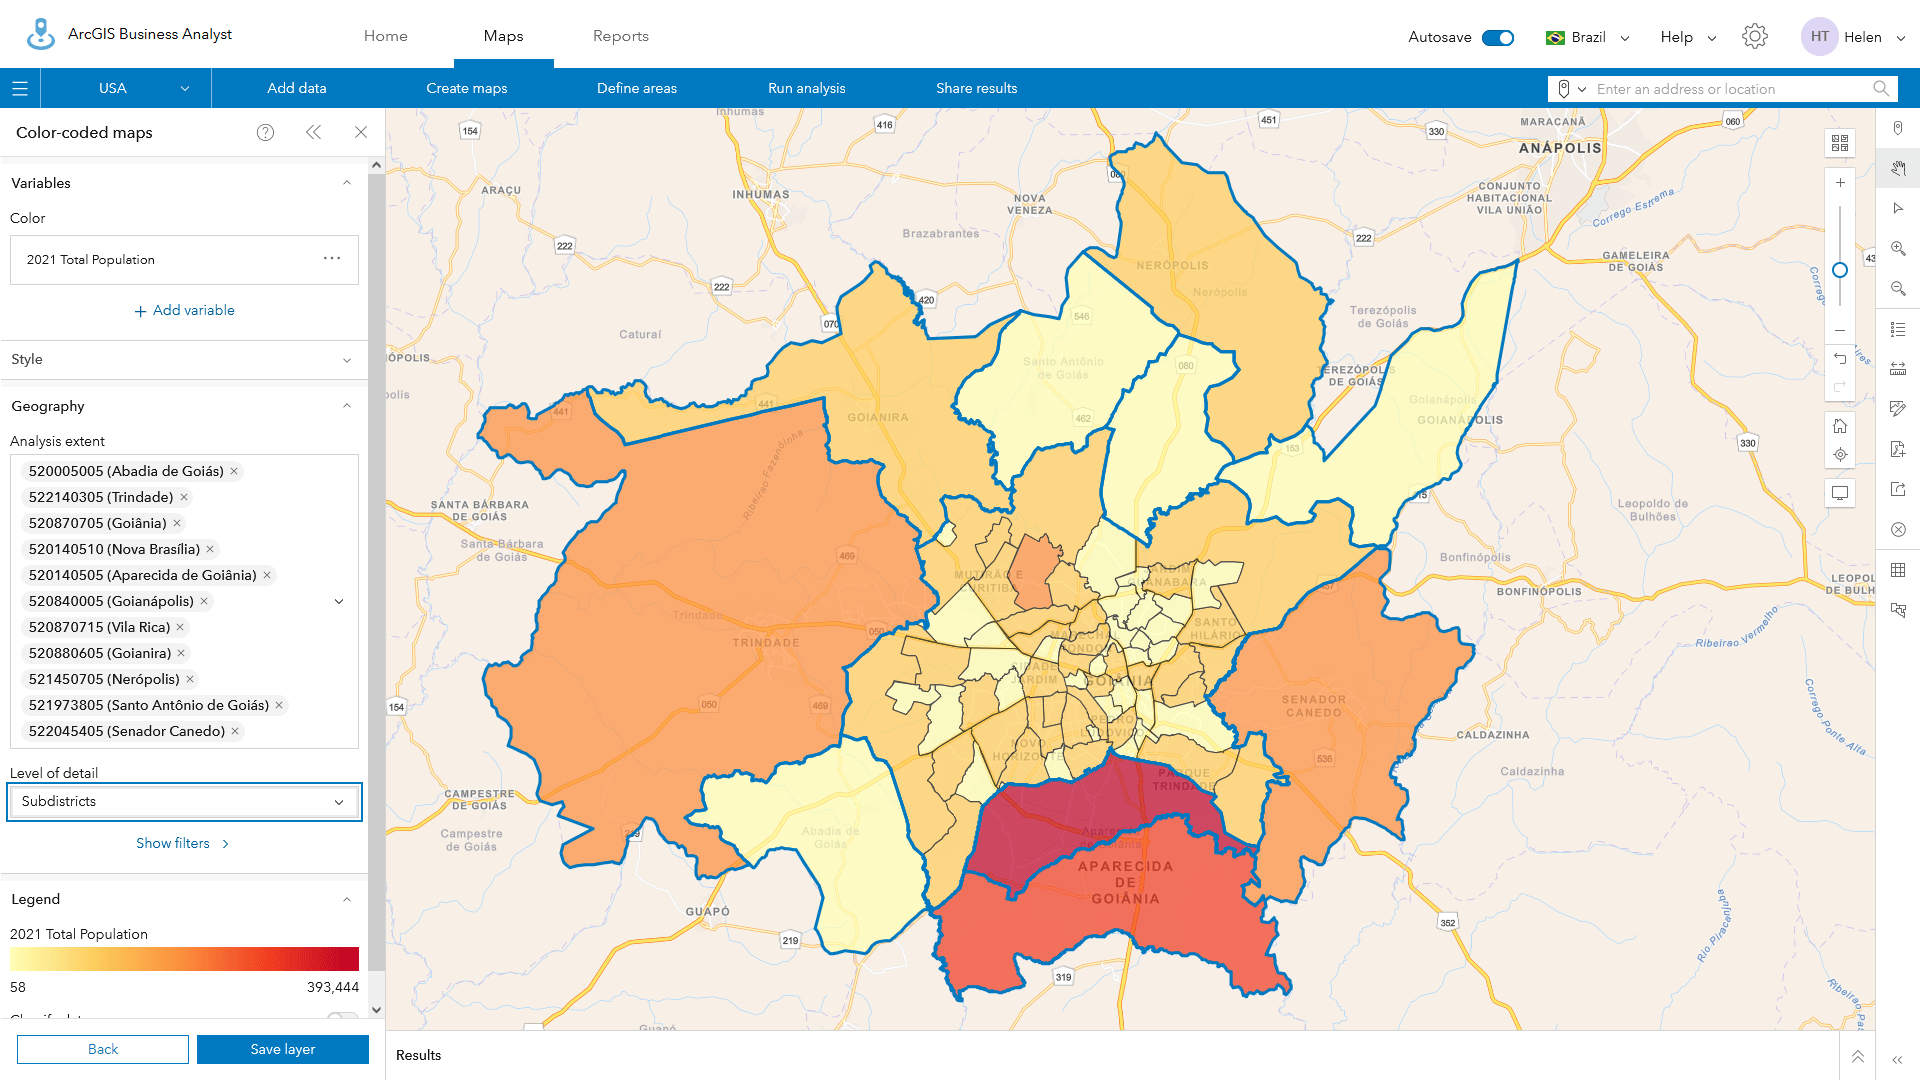
By switching to using 11 Districts around Brasilia rather than the State of Goiás, it is possible to use Sectors in smart map search and swap between any of the geographies, such as Subdistrict, as shown in the examples below.
Calculating which geographies will not be displayed, and when
You can use the 10,000 feature limit as a general guideline to understand which combinations of analysis extent and level of detail will cause certain geographies to not be mapped as part of your analysis. For example, in Brazil there are just 27 States with 315,788 Census Sectors. On average, each State has 11,696 Sectors (315,788 divided by 27), so it is likely that you will run into the CCM area display limit whenever using a State as the analysis extent. In contrast, the number of Sectors expected per Municipality is 57, as shown in the table below, which was copied from the Brazilian demographic documentation page.
| Geography Levels for Brazil | Number of Areas |
| Country | 1 |
| States | 27 |
| Municipalities | 5,570 |
| Districts | 10,283 |
| Subdistricts | 10,908 |
| Sectors | 315,788 |
In the U.S., there are 239,203 Block Groups and 51 States plus the District of Columbia, which equates to 4,690 per State on average. As the size and population of states varies considerably, it is not possible to map Block Groups for all of California, New York, or many other populous states. In Canada, some of the 13 Provinces or Territories cannot be mapped at Dissemination Areas-level in CCM because there are 56,590 DAs.
Similarly, in Italy and Portugal, there are hundreds of thousands of detailed Census Areas (401,547 in Italy and 210,170 in Portugal) that restrict mapping at the District or Regional level.
The regional demographic data resources page has detailed documentation of the number of areas for each of the 175+ countries available in CCM.
We’ve also created a short video to help you use and understand this new capability. One of the features I especially like is the search function to set the analysis area which prioritizes areas based on geographic window, population and popularity.
What next?
We continue to enhance and expand functionality in Business Analyst Web App and plan to enhance color-coded maps in ArcGIS Business Analyst Pro as well. In future releases, we will add more interactivity, publishing and sharing features into this workflow.
Until then, I encourage you to explore this exciting capability, including the interactive panel and new controls, because they offer powerful ways to better explore, focus on, and understand data targeted to specific areas of interest and levels of detail.

Article Discussion: