Composite indices, like the UNDP’s Human Development Index, and the CDC’s Environmental Justice Index combine multiple variables into a single indicator. Calculating an index is a simple process (especially using the new Calculate Composite Index tool in ArcGIS Pro!). However, designing and implementing an appropriate index is not a simple process. Like most spatial analysis, the process of creating an index is highly subjective. Seemingly inconspicuous choices have the power to drastically change your results.
Below, we’ll walk through 5 tips you can apply to avoid some of the most common pitfalls in the process of creating an index. The Esri technical paper Creating Composite Indices Using ArcGIS: Best Practices dives deeper into these topics – you’ll find references to the relevant sections of the document alongside each tip.
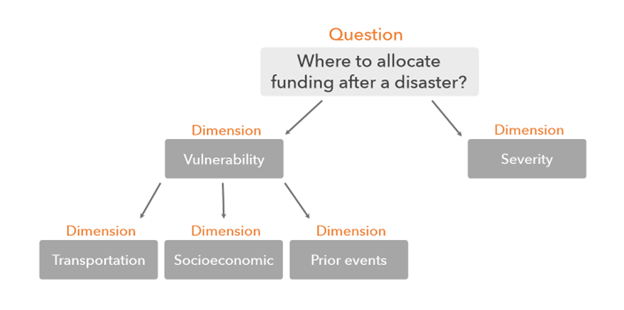
Tip 1: Work with stakeholders to define the question
The creation of an index often falls into the hands of the GIS analyst. But it’s important to not design the index in isolation – work with stakeholders such as those who will make decisions with the index, and the communities who will be impacted by the index. These stakeholders can help you gain a deeper understanding of their priorities, and therefore what components the index should be made up of. This step is arguably the most critical part in making an appropriate index – it informs the choice and weight of variables, the preprocessing methods, the methods used to combine variables, and the post-processing methods used to convey results. It’s not advised to create an index to be applicable to many different domains – an index should be treated as an analysis result, which was designed to answer a specific question.
Tip 2: Consider using variables about experiences instead of people
Indices are sometimes created using variables such as the percentage of minorities, or the percentage of elderly people. These are variables about who people are. Instead, it may be more appropriate to include variables about what people experience. Variables about who people are may serve to stereotype or over-simplify the experiences of certain groups. As an example, let’s say you are designing a natural hazard risk index. Perhaps you choose to include a variable representing the percentage of elderly people living in each census tract. But instead consider whether there is a variable (or multiple) that might get closer to representing the lived experience that causes increased risk to natural hazards. If it’s because elderly people might be less able to mobilize in the event of a natural hazard, try to find variables such as low mobility or level of social isolation, as these may better reflect the true population at risk.

Tip 3: Use strategies to avoid unintentional weighting
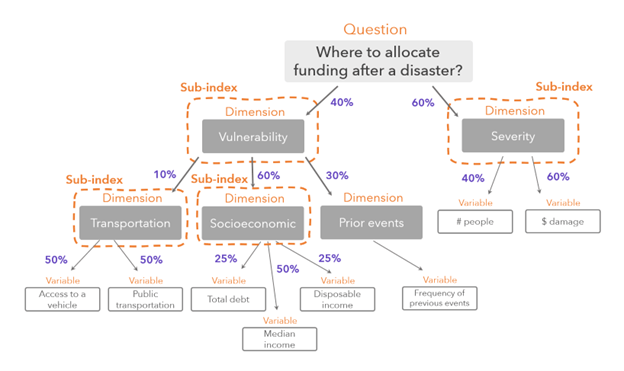
Our natural instinct can be to include as many variables as possible in an index. However, this may increase the likelihood that the index is being unintentionally weighted. What does this mean? Consider an index that includes three variables which are all equally as important: percent of people on food stamps, percent of people below the poverty line, and number of grocery stores within 1 mile. The food stamps and poverty line variables can be expected to be very similar in most locations – when the percent of people on food stamps is high, the percent of people above the poverty line is also likely to be high. This means the index will essentially be double counting these variables – the index will be highest in places where these variables are both high, and the number of grocery stores variable will have much less influence on the results. By very intentionally selecting the appropriate variables based on the index question, we decrease the likelihood of this problem occurring. However, there are also other strategies available to help adjust the importance of the variables, such as employing the use of sub-indices.
Tip 4: Treat equal weights as a form of weighting
When combining the variables into the index, you may choose to weight variables to indicate that some are more important than others. In the absence of clear instruction on which variables are more important, equal weighting is often applied. However, equal weighting should be treated as a form of weighting! Think of weighting as a way to indicate importance – equal weighting should be seen as a statement that “these variables are all equally as important as each other”. Of course, this statement might be true – but it should still be a decision that is intentionally made in consultation with your stakeholders.
Tip 5: Interrogate and iterate on your results
You’ve carefully designed and created the index, and have your result – phew…we’re done, right? Well, not exactly. Creating an index is a highly subjective and iterative process. It’s wise to treat the results as a starting point, interrogating them closely to assess whether the question has been answered appropriately. This interrogation might include some of the following:
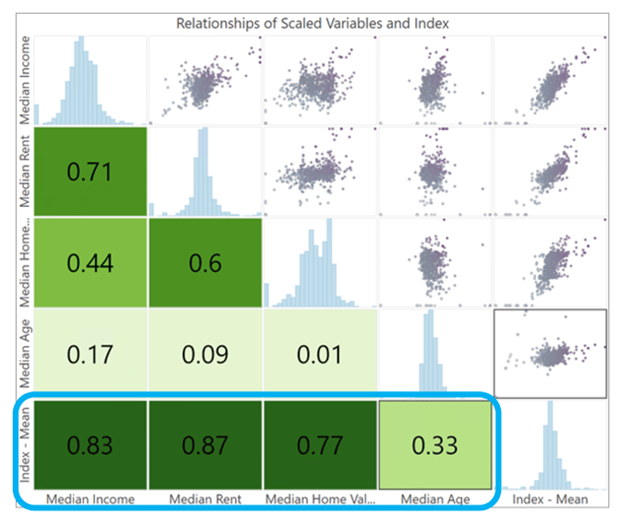
- Assess how each variable is correlated with the final index, to figure out whether the contribution of each variable was as expected.
- Explore the results on the map. Check where the high and low index values are located, and study the composition of the input variables for these locations. Compare locations with similar results and explore whether the variable contribution differs.
- Share the index with those who live in or know the study area, and ask them for feedback on whether the results reflect their understanding and experience of their communities.
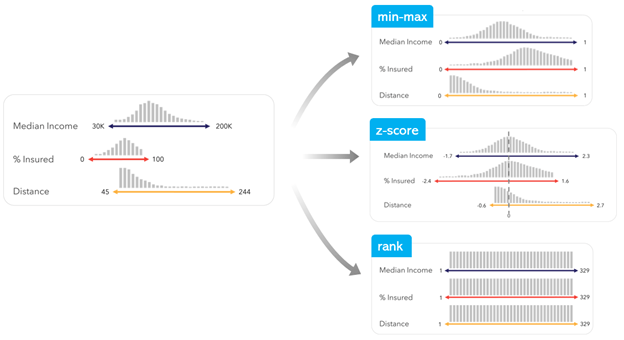
- Create the index again using different preprocessing methods or combination methods. You can evaluate how much this changed the results by calculating the change in rank for each location. If the changes in rank are high, this indicates the index result was very sensitive to the methods applied.
Applying these 5 tips can help you create a better and more appropriate index. The Esri technical paper Creating Composite Indices Using ArcGIS: Best Practices goes deeper into these topics, and also lays out a 10 step process you can use to create an effective index. The Calculate Composite Index tool, available in ArcGIS Pro 3.1, can help streamline the process of creating the index, so you can spend more of your time on designing, evaluating, and disseminating. We look forward to seeing the indices you create!
If you’ll be attending the 2023 user conference and want to learn more about indices, attend our workshop Creating Indices: Combining Variables to Make Better Decisions. You can also visit us in the showcase to ask us questions – find us at the Spatial Statistics kiosk in the Spatial Analytics island.
Check out esriurl.com/spatialstats to find other resources about spatial statistics tools in ArcGIS Pro.


Article Discussion: