The June release of ArcGIS Velocity is here! Several highlights of this release include:
- New output types for sending output features or values to Amazon SNS, Amazon SQS, and AWS IoT.
- A new Create Range Fans tool that generates a range fan on incoming event point data.
- Administrators can now start, stop, edit, delete, move, and share other users’ feeds and analytics in the organization.
Let’s take a deeper dive into each of these and other new capabilities and enhancements in this release! To see some of these new enhancements in action, check out a short video over on the ArcGIS Velocity Community.
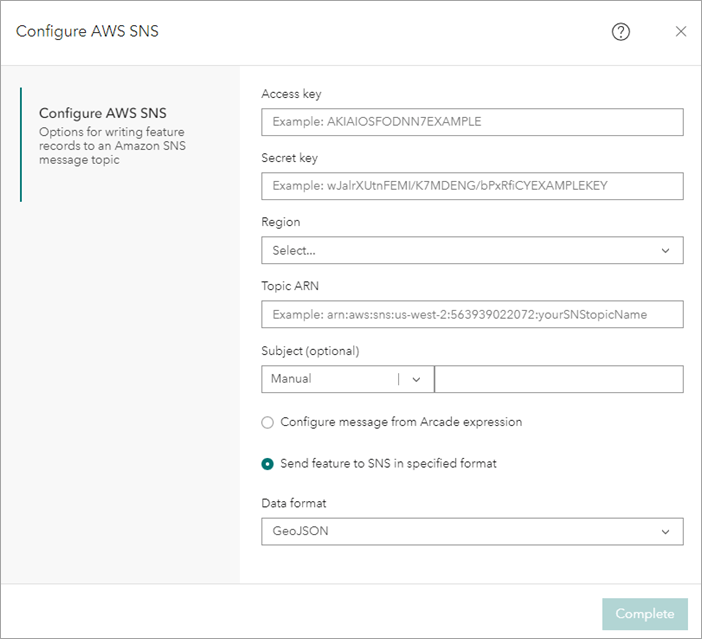
Amazon SNS Output
The new Amazon SNS output allows you to write output features to the Amazon Simple Notification Service (SNS). Amazon SNS is a fully managed pub/sub service for A2A (application to application) and A2P (application to person) messaging. By using this output, you can integrate and decouple distributed applications and provide notifications through SMS texts, push notifications, and email using the Amazon SNS platform.
Amazon SQS Output
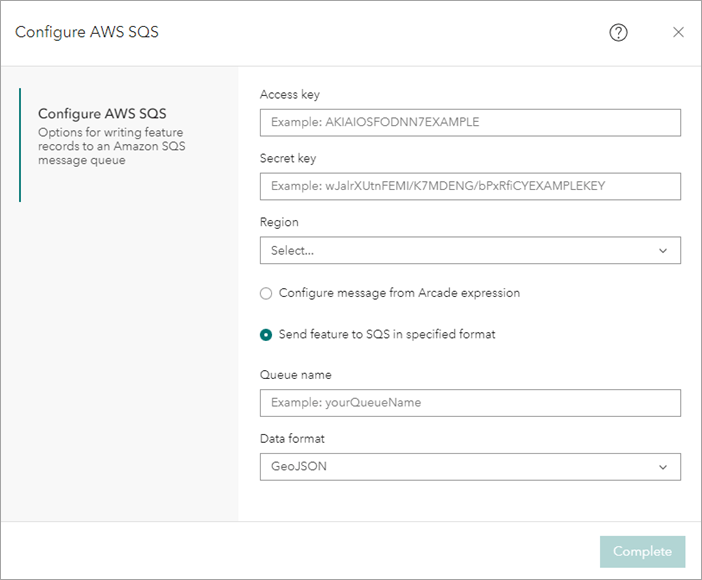
Another new output at this release, and similar to the new Amazon SNS output above, is the Amazon SQS output. This output allows you to write output features or data to the Amazon Simple Queue Service (SQS), so you can then send, store, and receive messages between different software components.
AWS IoT Output
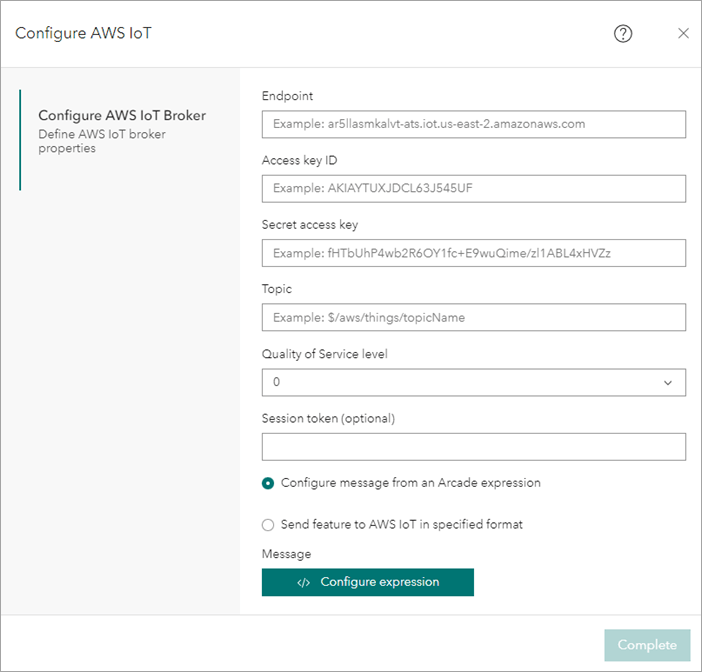
The last new output new at this release is the AWS IoT output. It allows you to send event data processed in ArcGIS Velocity to AWS IoT, where it can then be stored, analyzed, and provided to other systems used by your organization.
Share Feed and Analytic Properties
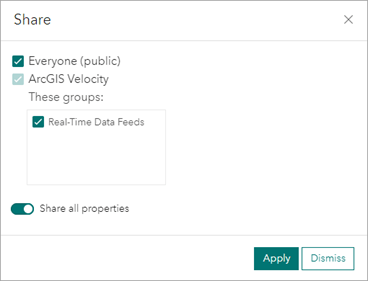
You can now optionally share feed properties directly in ArcGIS Velocity to other users in your organization or specific groupsSharing feed properties means that other users can view certain feed connection properties such as the source URL of the data for an HTTP feed. This enables users to make a copy of a feed and run it themselves, changing connection parameters such as query settings, as needed. Sensitive connection information such as passwords and secret keys however are never shared, even if you choose to share feed properties.
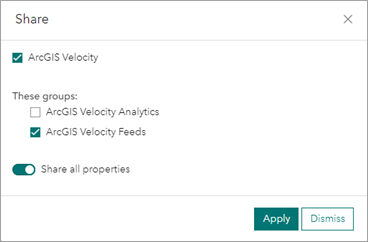
As with feeds, you can now optionally share analytic properties to other users in your organization or specific groups. Sharing analytic properties means that other users can view certain data source connection properties such as the address of an Amazon S3 bucket. This enables other users to make a copy of an analytic and use it as a template, changing only data source connection parameters as needed. Sensitive connection information such as passwords and secret keys however are never shared, even if you choose to share analytic properties.
Create Range Fans Tool
The new Create Range Fans tool generates a range fan, which is a two-dimensional feature in the shape of a wedge, on incoming event point data. The tool can be used in both your real-time and big data analytics. A range fan can be used to represent a visual or contextual range of a feature and is specified using a range distance, bearing, and arc angle.
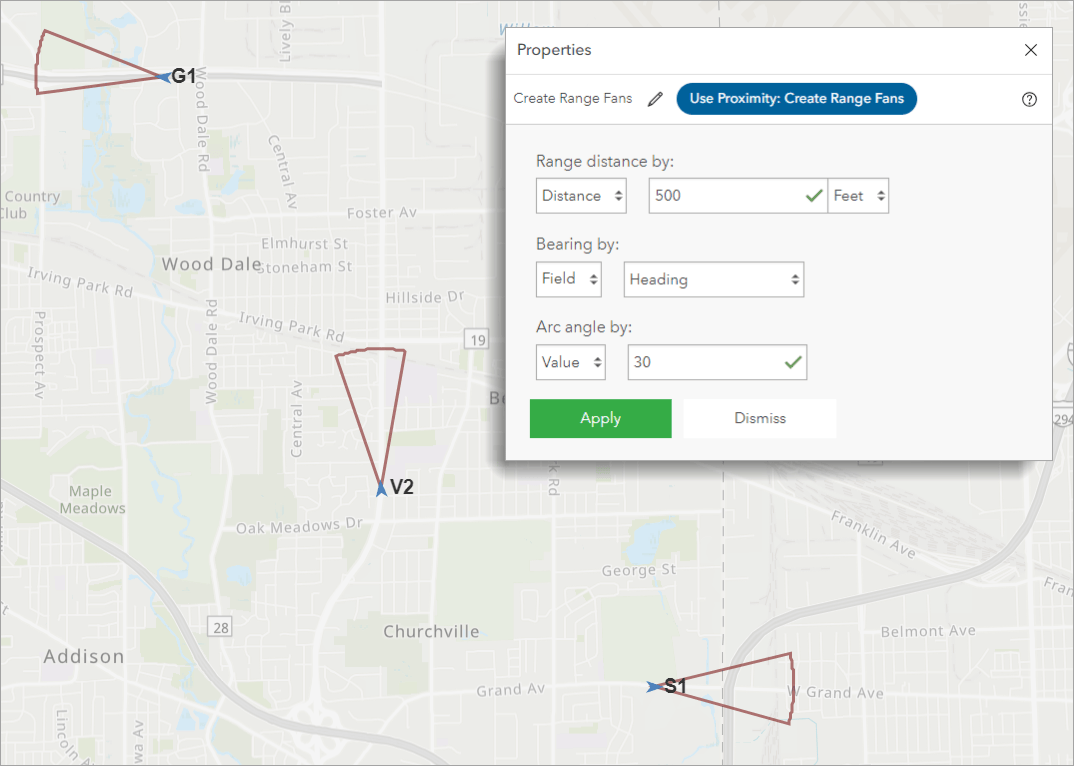
Range fans are useful in field user or asset tracking use cases such as when trying to understand the field of view for individuals involved in search and rescue operations, or when attempting to visualize where a tracked fleet vehicle might be headed next.
Analytic Authoring Experience
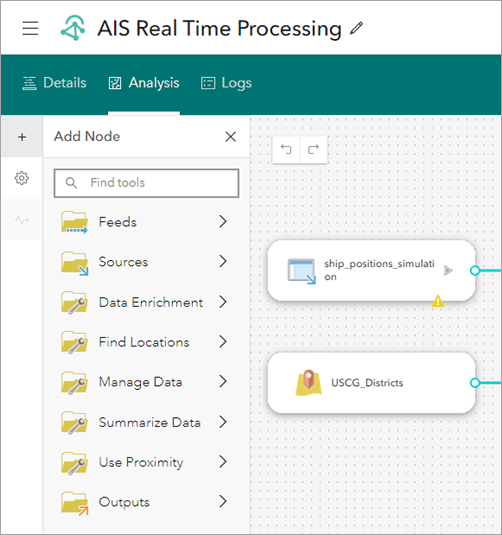
In this release, several usability improvements were made to the analytic authoring experience in ArcGIS Velocity. First, you’ll notice the folders you use to access and add nodes such as feeds, data sources, tools, and outputs are now available on the left side of the analytic editor.
Second, the analytic configuration settings such as analytic metrics, smart layout, and route animation settings are also now available on the left side of the analytic editor.
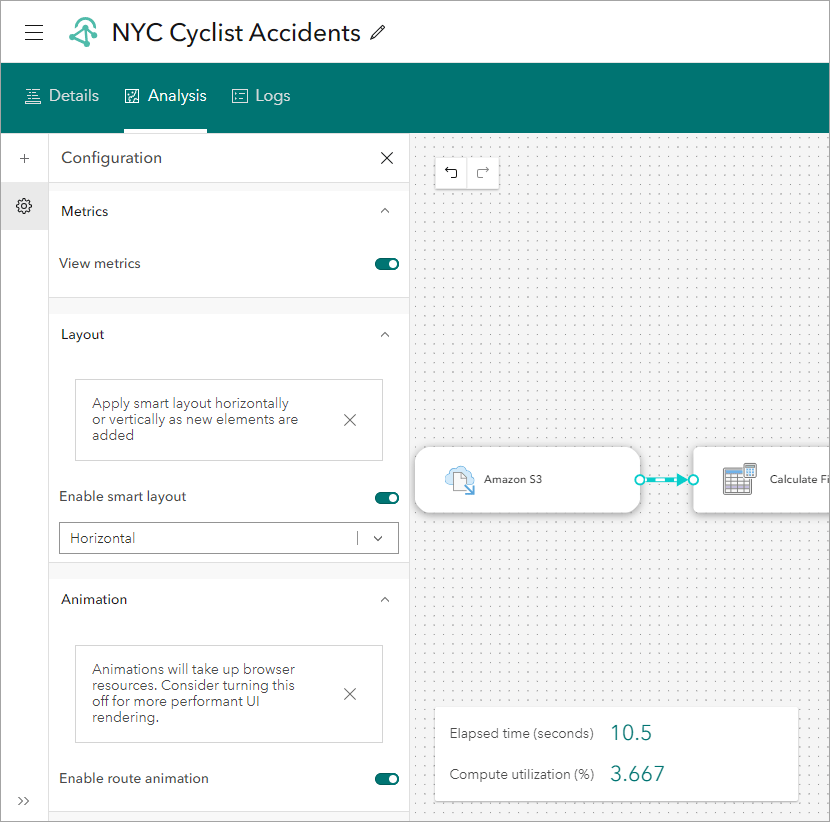
Overall, this updated experience provides more screen real estate to arrange and work with your analytic models, while easily accessing interface components as needed.
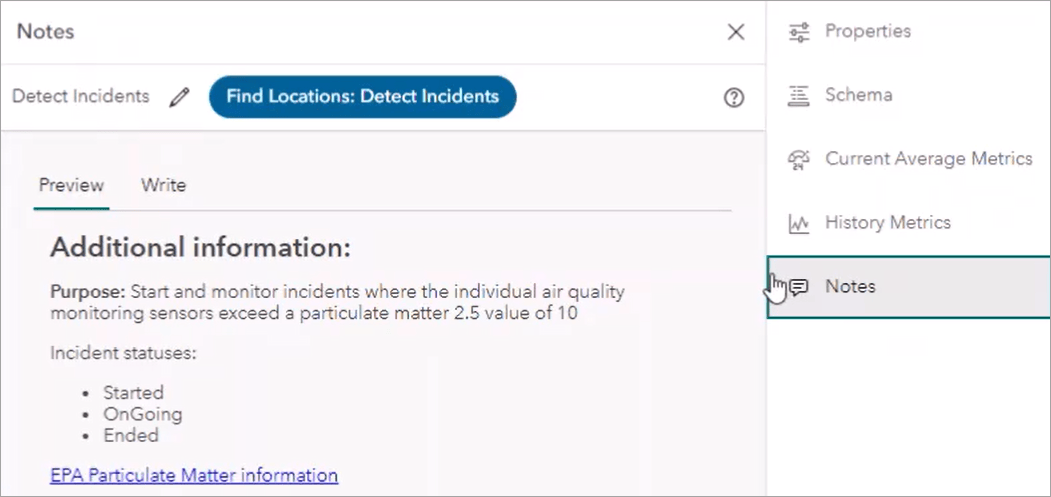
The last analytic enhancement to highlight is the ability to add notes to the various analytical steps (i.e. nodes) in your real-time and big data analytics. A note can include text, bulleted lists, hyperlinks, and code that can describe information about that step in the analysis, or high-level information about processing workflows. To add a note to a given node, select it and click the Notes icon on the right to activate the Notes pane. Here you can add relevant information about the node or overall workflow.
Administrator Privileges
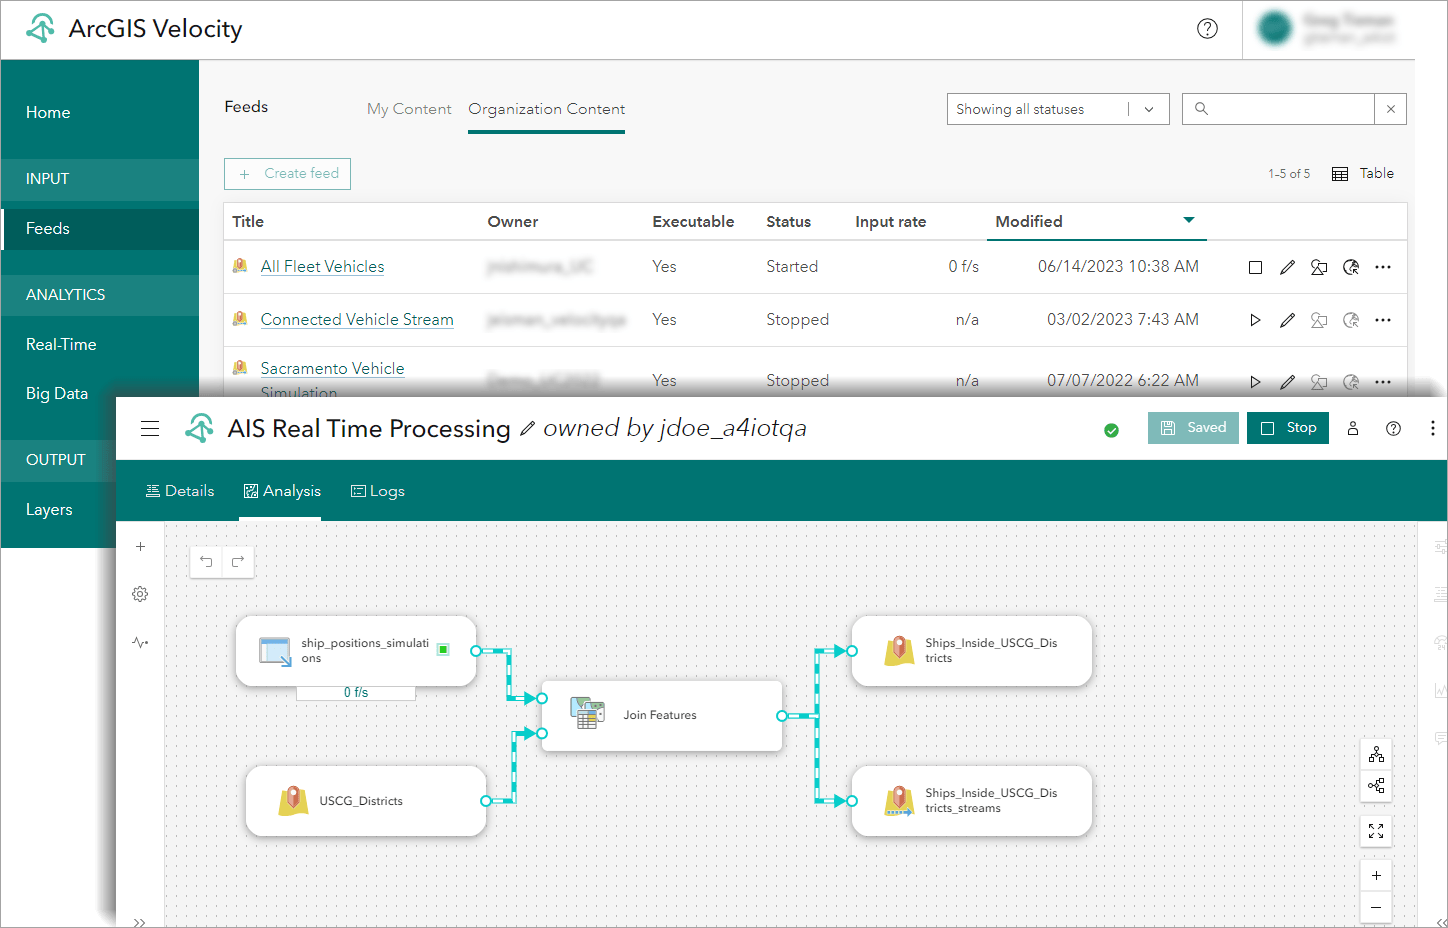
For administrators of ArcGIS Online organizations, you now can start, stop, edit, delete, move, and share other users feeds and analytics. This new capability gives administrators access to and the flexibility to manage ArcGIS Velocity items in their organization.
Workflow View Removed
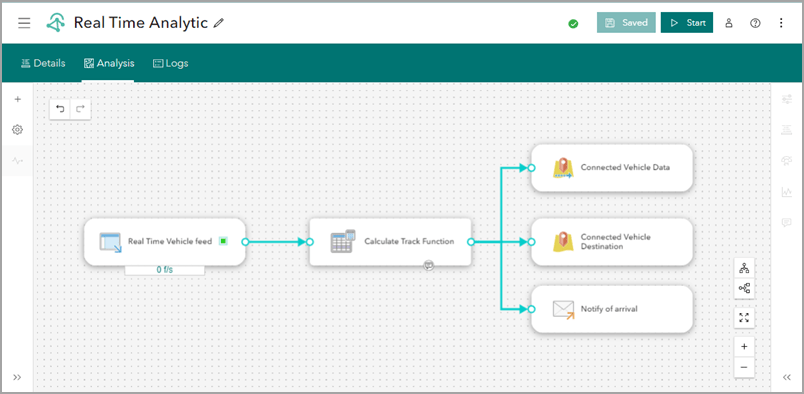
As mentioned in the previous release blog, the analytic workflow view is now removed from Velocity in this release. Meaning, moving forward, the model view, illustrated below, is the only view available when creating all your real-time and big data analytics.
And more…
For a complete list of enhancements, check out the what’s new topic in the documentation. If you have ideas, enhancements, feature requests for the product, be sure to post them on the ArcGIS Velocity Ideas board in the Esri Community.
To learn more about Velocity, peruse all the available resources including product videos, tutorials, documentation, and more!

Article Discussion: