You’ve launched a new initiative to reforest your city – creating more green spaces, more shade, more areas to explore, and more biodiversity. How are residents responding? Are they interested? Are they engaged? Are they getting involved? Are they coming back to your Hub site time and time again to track progress?
Now you can get these invaluable insights right in your inbox.
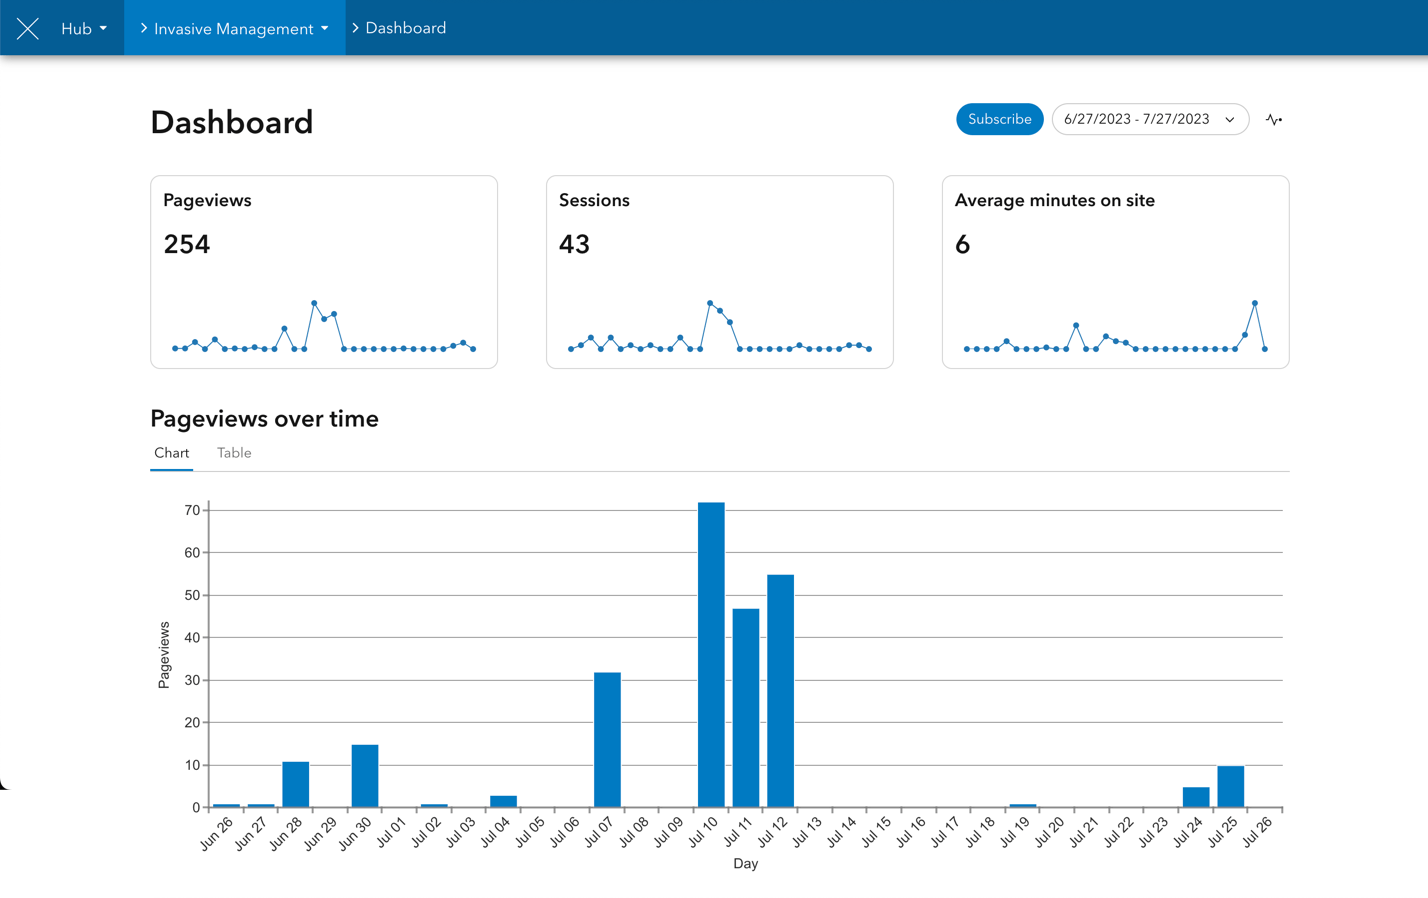
All Hub customers have been able to see key metrics on their Hub’s engagement dashboard. But now Hub packages those metrics up in a weekly email digest for Hub Premium customers, so you can have near real-time insights on your site’s performance without even needing to log into Hub. ArcGIS Hub Premium customers will see a new “subscribe” option in the top right of their Hub site’s engagement dashboard (`<yourSite>/ dashboard/edit`).

This weekly email report contains metrics on:
- Site Views
- Top 10 Referrers
- Page Views by User Type (staff, anonymous users, community users)
- Top 10 Public Content Item Page Views
- Top 10 Public Content Downloads
We’ll be bringing more metrics to this email report over time, like top search terms, as well as subscriptions for different time periods (e.g., daily, monthly, quarterly).
These reports will create an important feedback loop for the content you publish, letting you make timely decisions to maximize your reach and impact.
What other metrics would be most important for you? Let us know on Esri Community.
This post was edited on July 31, 2023 to specify that the top content downloads are only for public items.

Article Discussion: