Actions are an important part of dashboards. They make dashboards interactive, build focused views, and let users see the data that matters to them.
There are different types of actions that dashboards support. Until now, some of the actions that target map elements – pan, zoom, and flash location – have been limited to specific source element configurations.
With the June 2022 update of ArcGIS Dashboards, we’ve added more support for these actions. Now, elements like charts, tables, and category selectors showing categories from grouped values, can also be the source of pan, zoom, and flash actions.
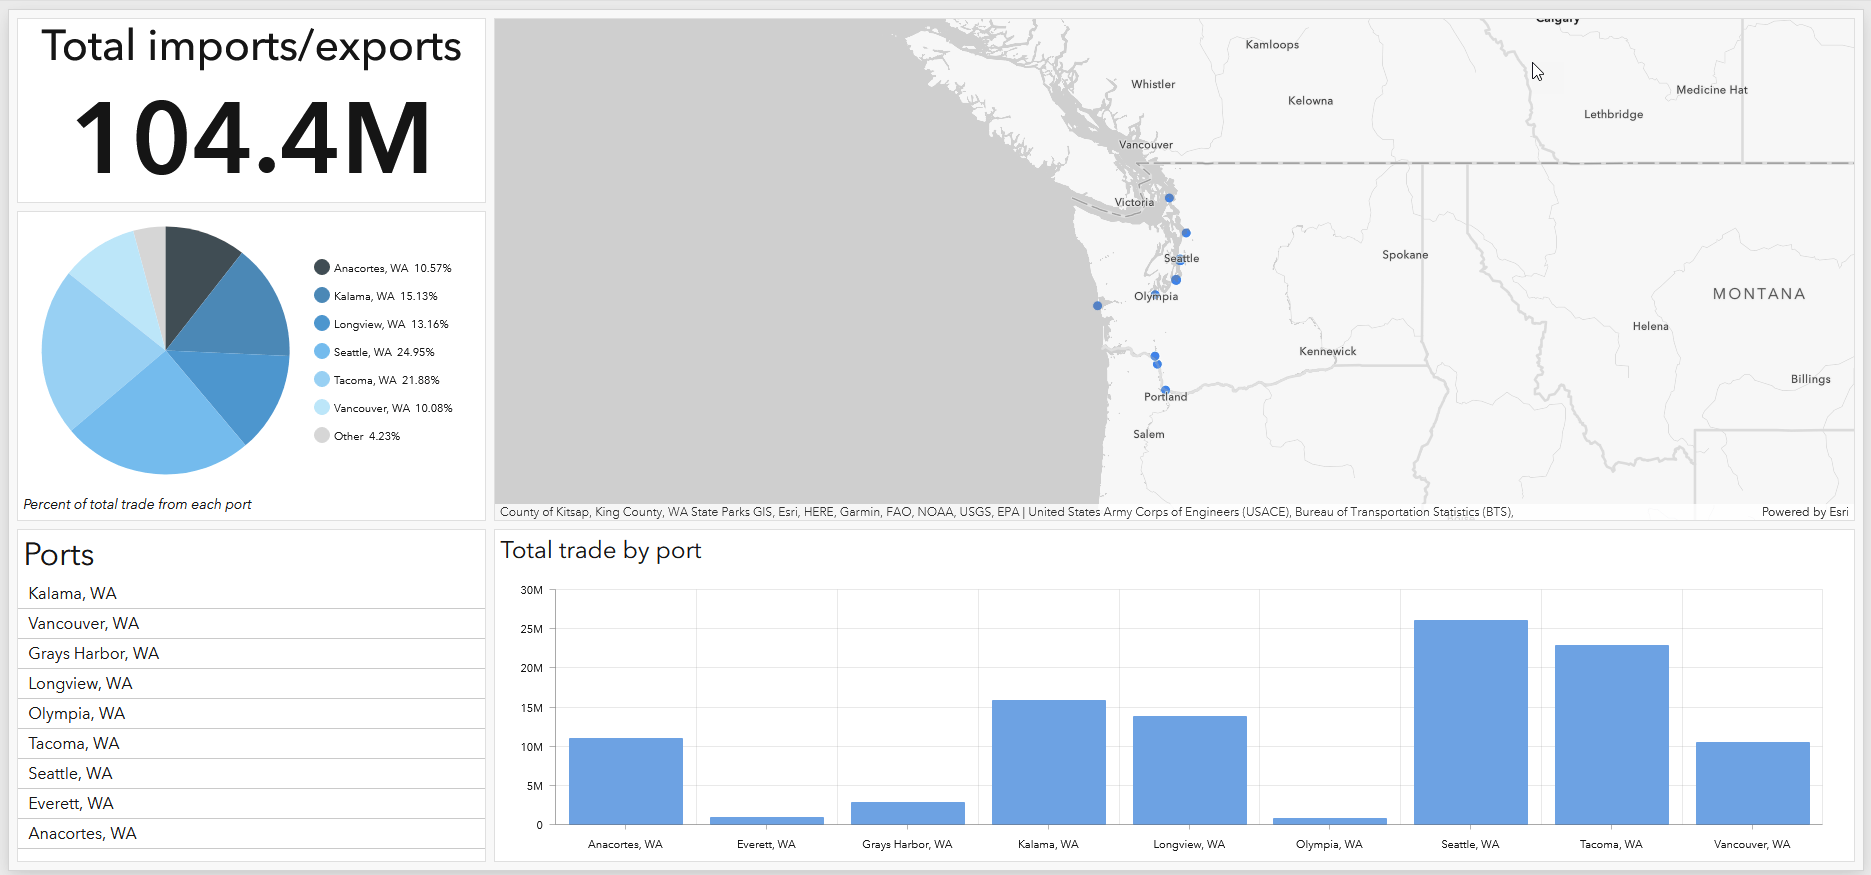
Take this dashboard for example.

Selecting a port from the list zooms the map to that location and flashes the port on the map. The two charts, however, are not able to zoom, pan, or flash a location on the map, since their categories are based on grouped values.
With the latest update of ArcGIS Dashboards, you can configure these same charts to zoom, pan, or flash the map.

Create your first dashboard or open your existing dashboards and add actions that target your maps and take your dashboard interactivity to new levels. Check out what else is new in ArcGIS Dashboards on our What’s new page.
You can find our team at the upcoming Esri UC and learn more about creating effective dashboards with ArcGIS Dashboards in our technical workshops. Register today! As always, we love seeing the dashboards you make. Share them with us on Twitter and LinkedIn using #ArcGISDashboards.

Article Discussion: