This is a packed release! Updates to the ArcGIS API for JavaScript span many aspects of the API, giving you the ability to switch between basemaps with different spatial references, create 3D heatmaps, provide your end users a more productive editing workflow, create striking visualizations of your imagery data using the (now out of beta) flow renderer, and a whole lot more. Let’s review some of the highlights.
Visualizing flow with FlowRenderer
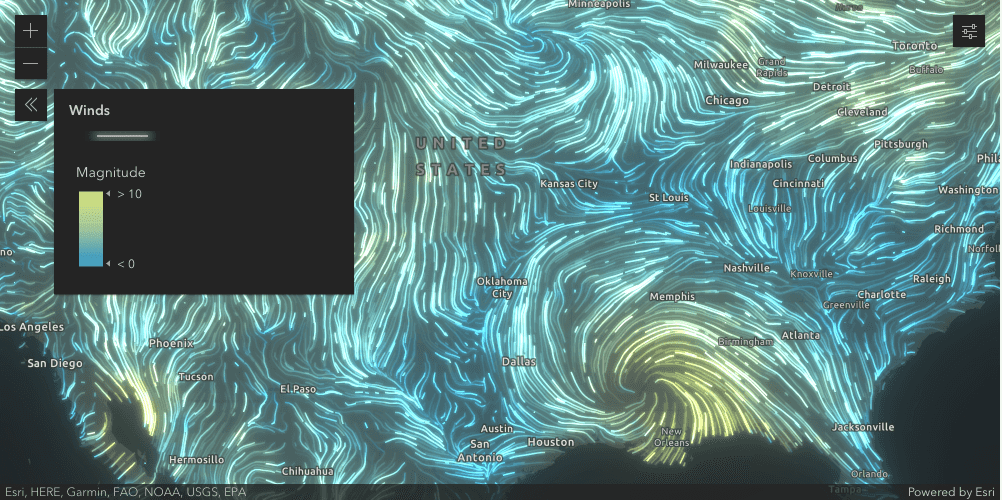
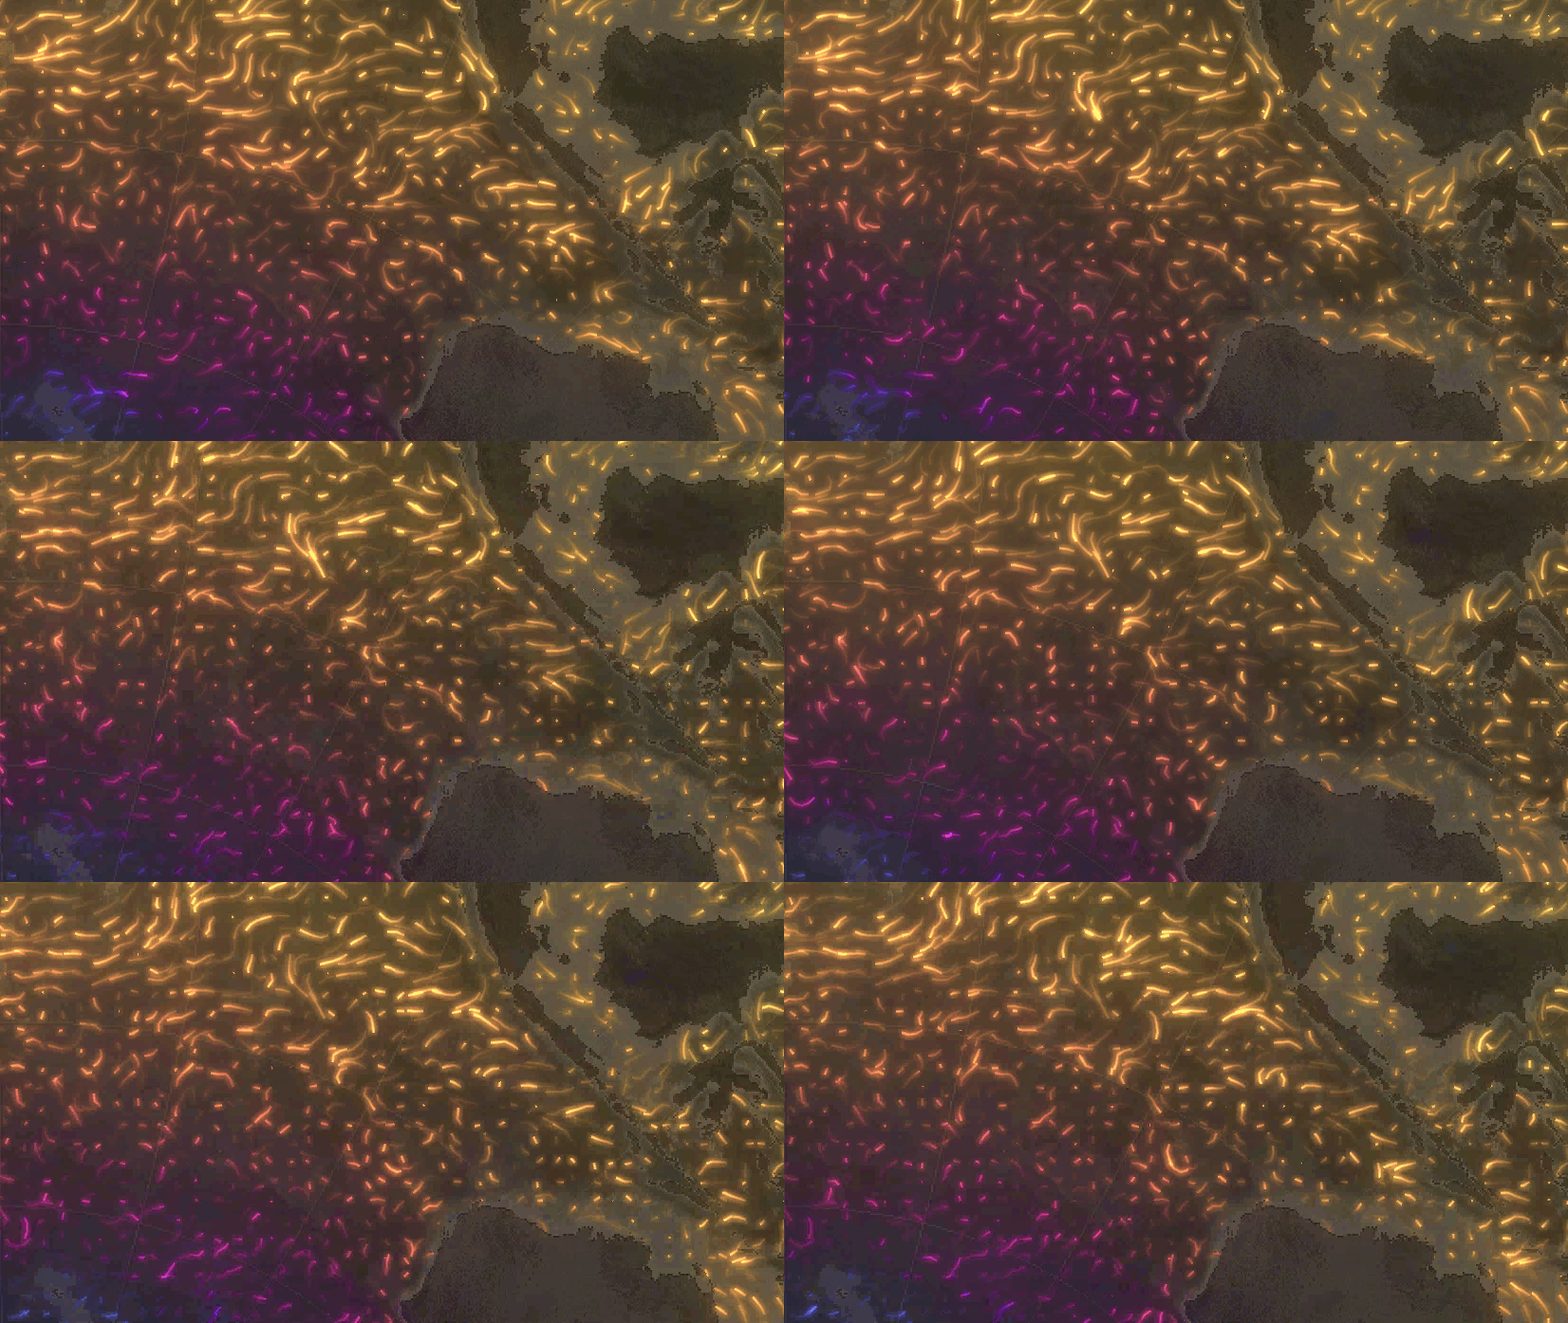
We recently introduced the animated flow renderer (in beta) which allows you to visualize flow direction and magnitude information for meteorology and oceanography raster data with animated streamlines. This API update brings the flow renderer out of beta and includes some important enhancements. You can:
- Drive the flow lines’ color, opacity, and/or size by the layer’s magnitude field. You can even use smart mapping to style the layer.
- Change the direction of the flow
- If your layer is time-aware, you can use it with the time slider which will visualize the flow at each time slice.
- Save the layer in a webmap
- Print it!
The following sample uses the FlowRenderer with visual variables to visualize wind speeds during Hurricane Ida. Learn more in the Create an animated flow visualization with the ArcGIS API for JavaScript blog.
Switch between spatial references (2D)
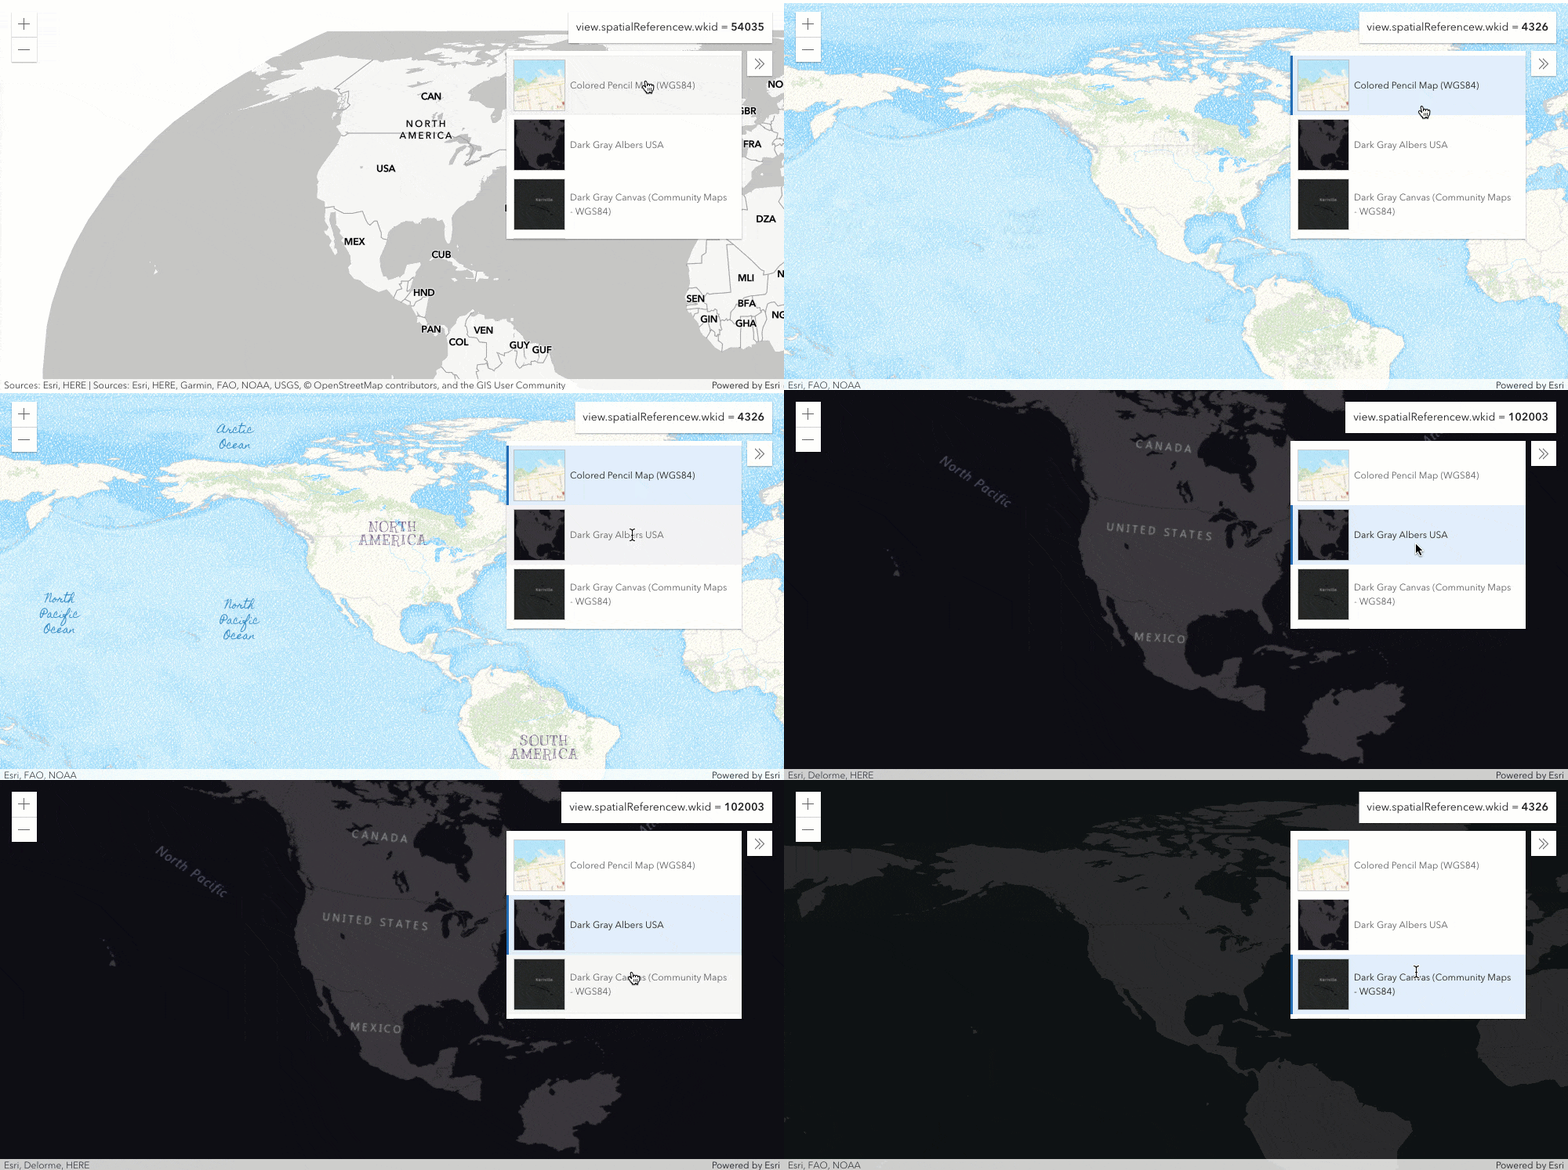
Easily switch the spatial reference of your map by simply setting the spatialReference property, or by changing to another basemap with a different spatial reference via the Basemap Gallery or Basemap Toggle widgets. This means that if you are using the Basemap Gallery widget, you can have basemaps with different spatial references for your end users to select from. Likewise, the Basemap Toggle can switch between two basemaps with different spatial references.
Check out Client-side projection and Basemaps with different projections samples to see this in action.
Heatmaps in 3D scenes!
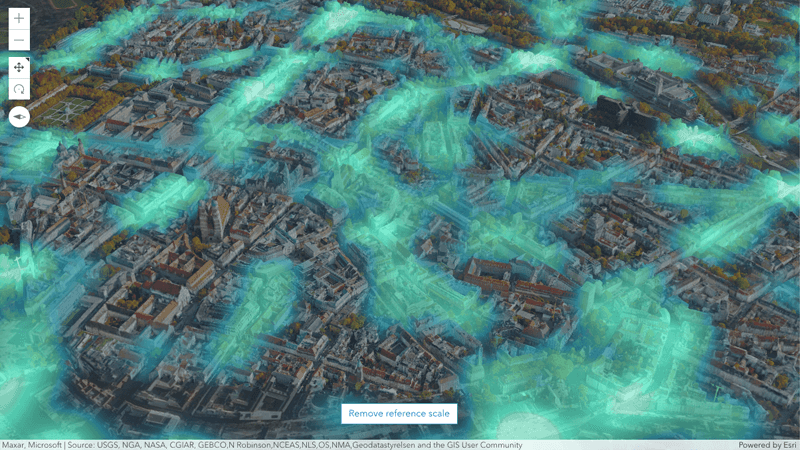
Emphasize high density areas along a continuous color ramp in your scene using the HeatmapRenderer. The color intensity of each pixel can be determined based solely on its proximity to one or more points or weighed based on a data value from the layer. The resulting raster can be draped on the ground or on top of integrated mesh layers. A new property called referenceScale allows you to adjust the blur radius independent of the current viewing scale.
The sample below allows you to explore traffic accidents in Munich. Under the hood, a feature layer containing traffic incidents is rendered as a heatmap and draped over an integrated mesh.
Weather widget
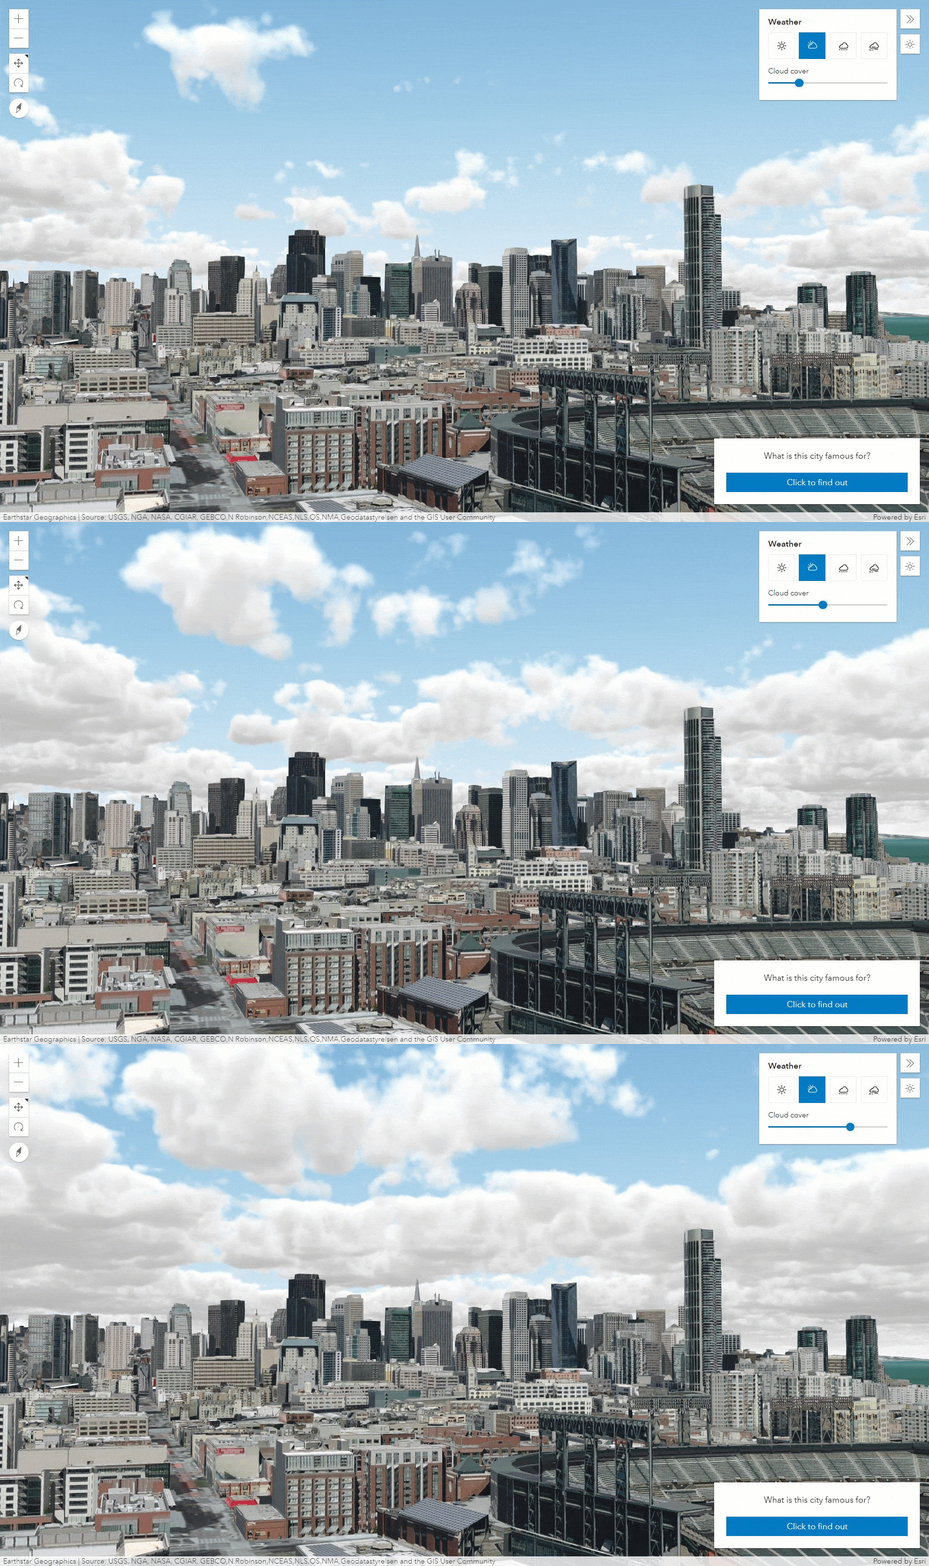
Change the weather between sunny, cloudy, rainy, and foggy in your scene using the new weather widget. You can interactively adjust the cloud cover or fog density using the widget’s slider.
Discover the widget in the updated weather sample.
More line and label styles in 3D scenes
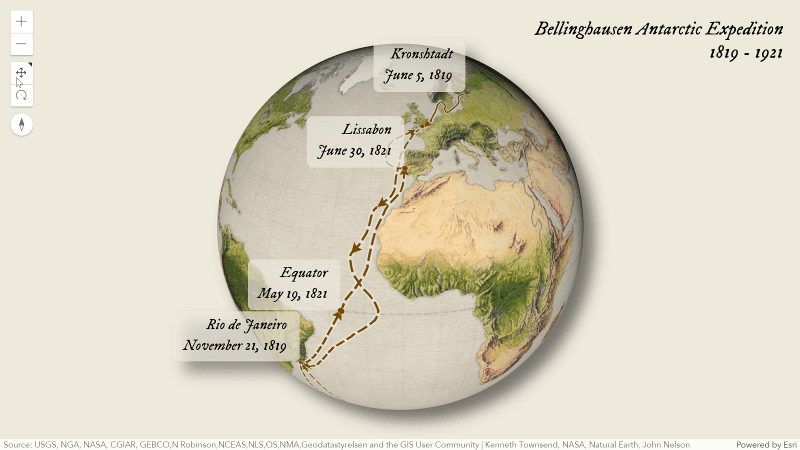
Add markers to your line features to emphasize their starting and ending points, or arrows to indicate a direction. The new LineStyleMarker3D class provides a variety of styles aligned with the existing 2D capabilities so the same layer can be displayed consistently in both 2D and 3D. The markers can be driven by attribute values and support using visual variables.
Improve the appearance of labels and text in your scenes by using the new styling options on TextSymbol3DLayer. Updates include decorations (such as underlines and strikethrough), settings for better text layout (i.e. line spacing and alignment), as well as loading custom fonts. Emphasize specific labels or enhance readability by adding a background to the label symbol.
Explore the first expedition to Antarctica with the help of new line markers and label placement in this sample.
Virtual light
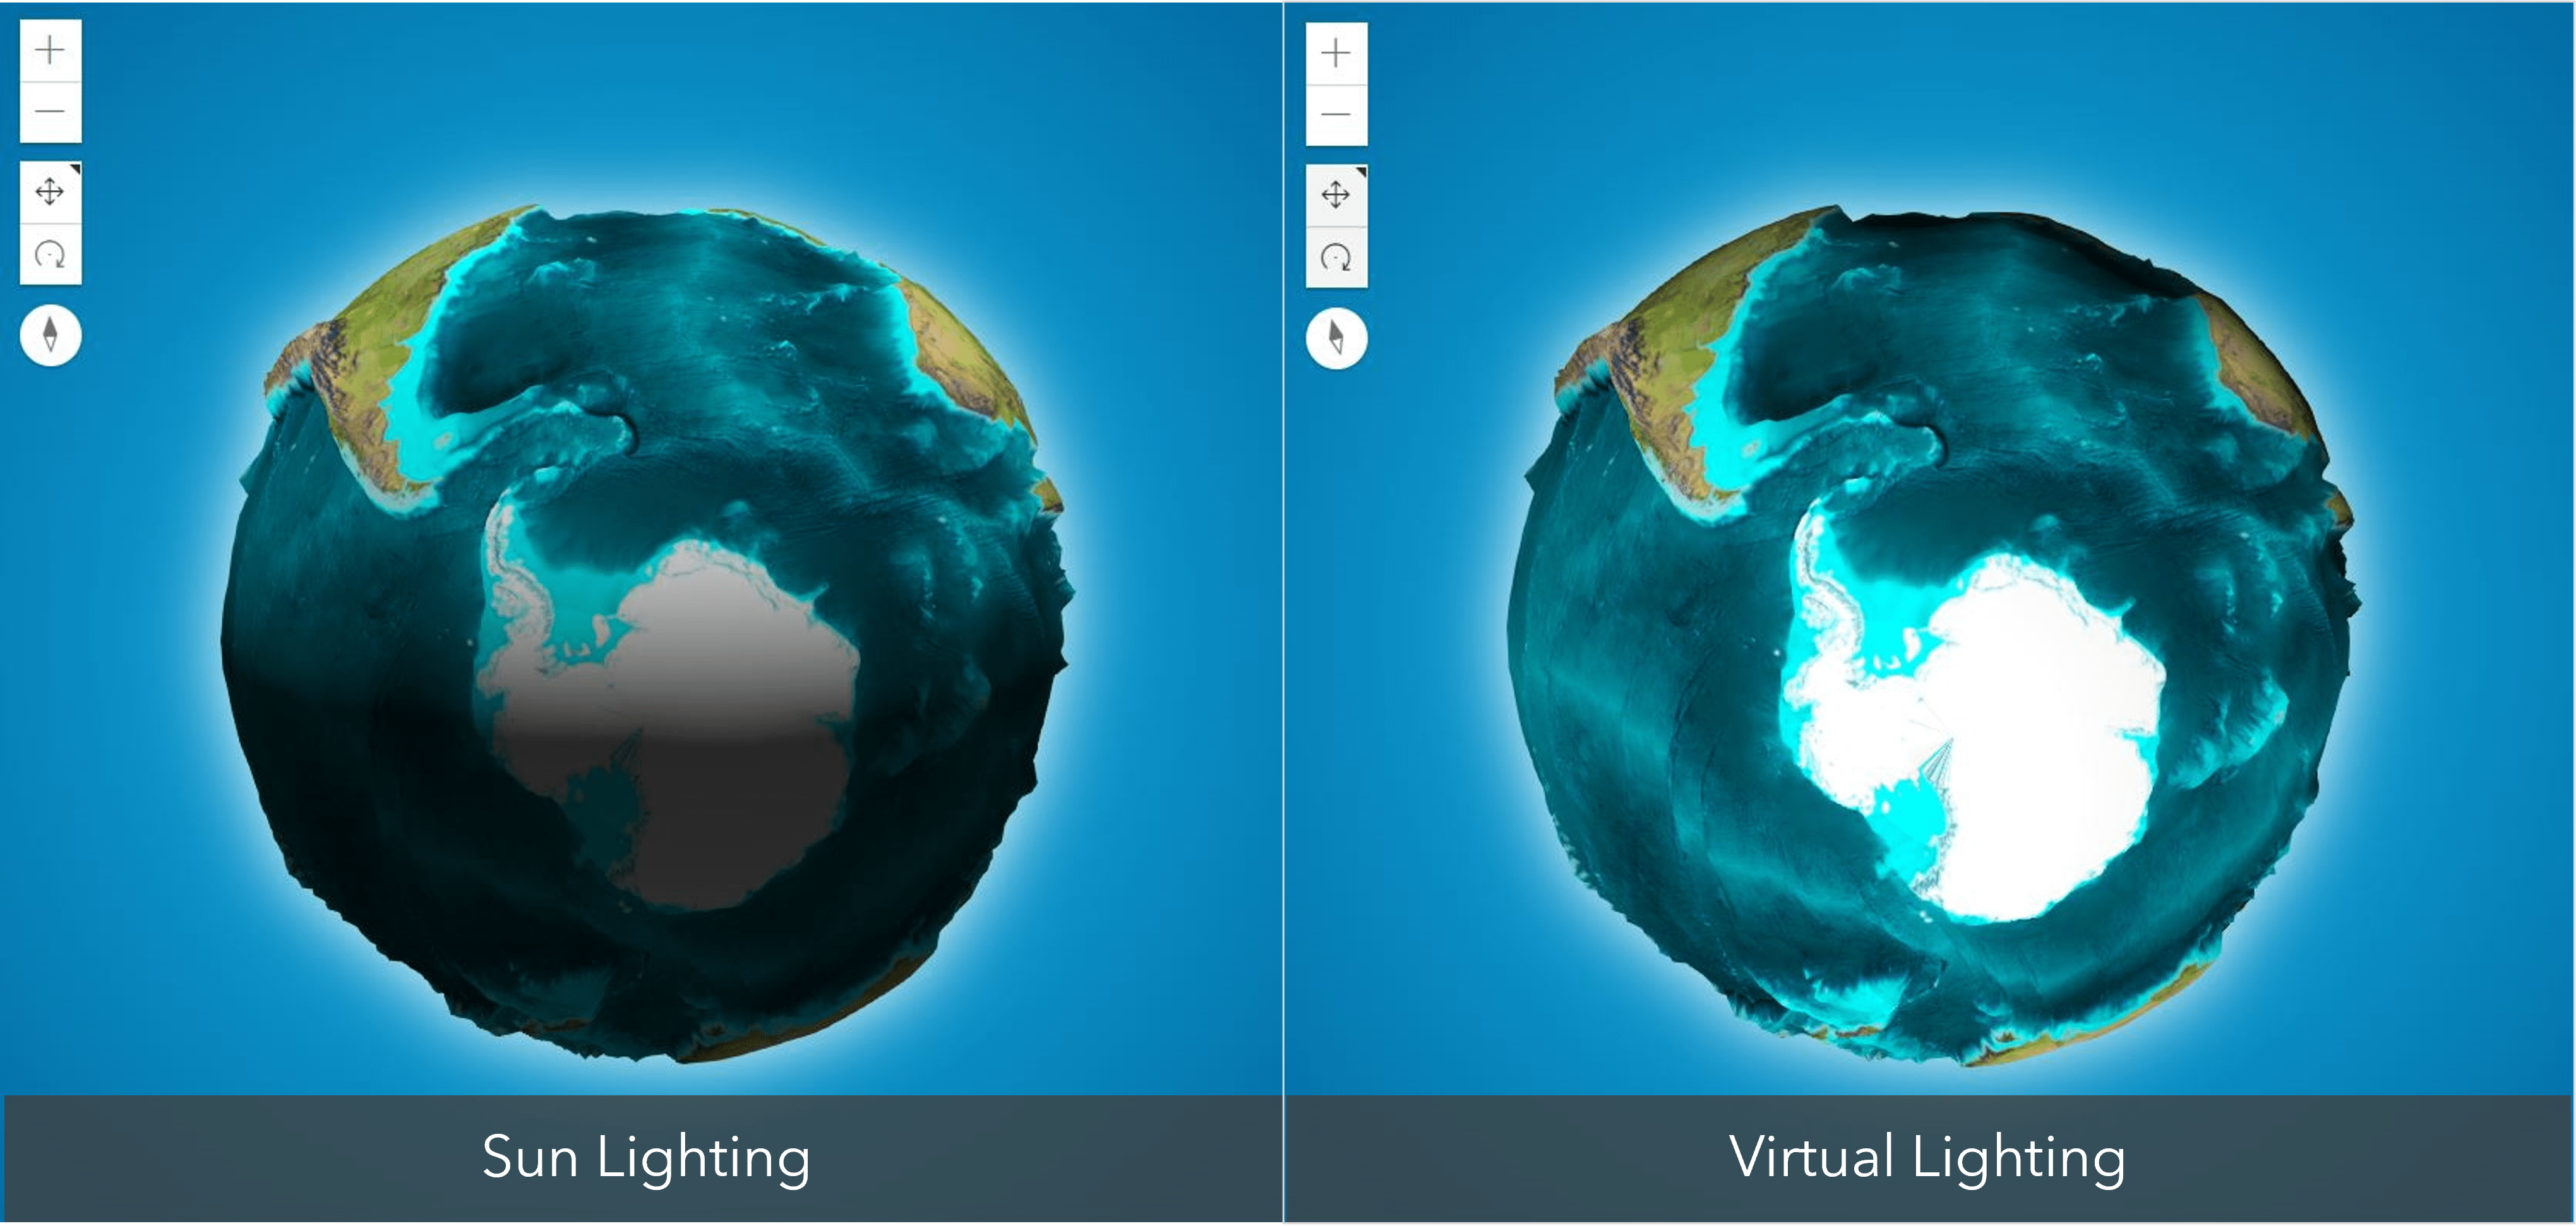
Light up your 3D visualizations around the globe, especially in polar areas using the new VirtualLighting option. By setting the SceneView environment’s lighting property you can position the light source relative to the camera, minimizing the amount of visible shadows.
See how the new virtual lighting helps explore exaggerated terrain around the globe in this sample.
Introducing analysis objects
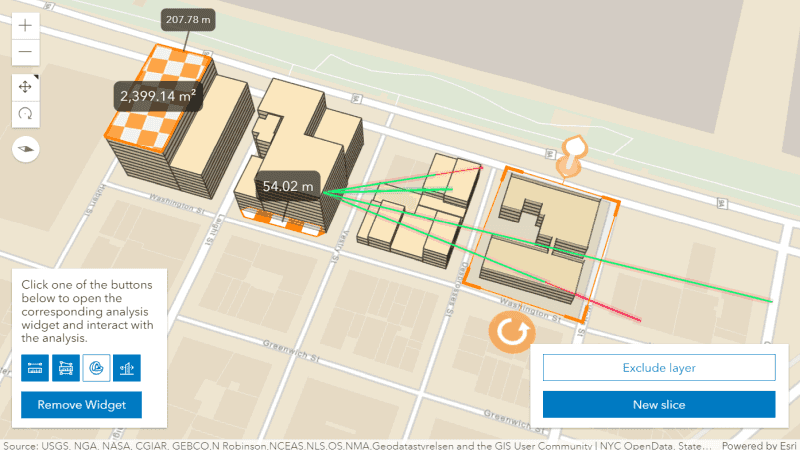
Programmatically perform client-side measurements, slices and line of sight analysis and then display the results in your scene. You can also pass the analyses to the constructor of the corresponding widget to set their initial state and allow for further user interaction.
The below sample shows how to create analysis objects programmatically, with optional user interaction.
A better editing experience
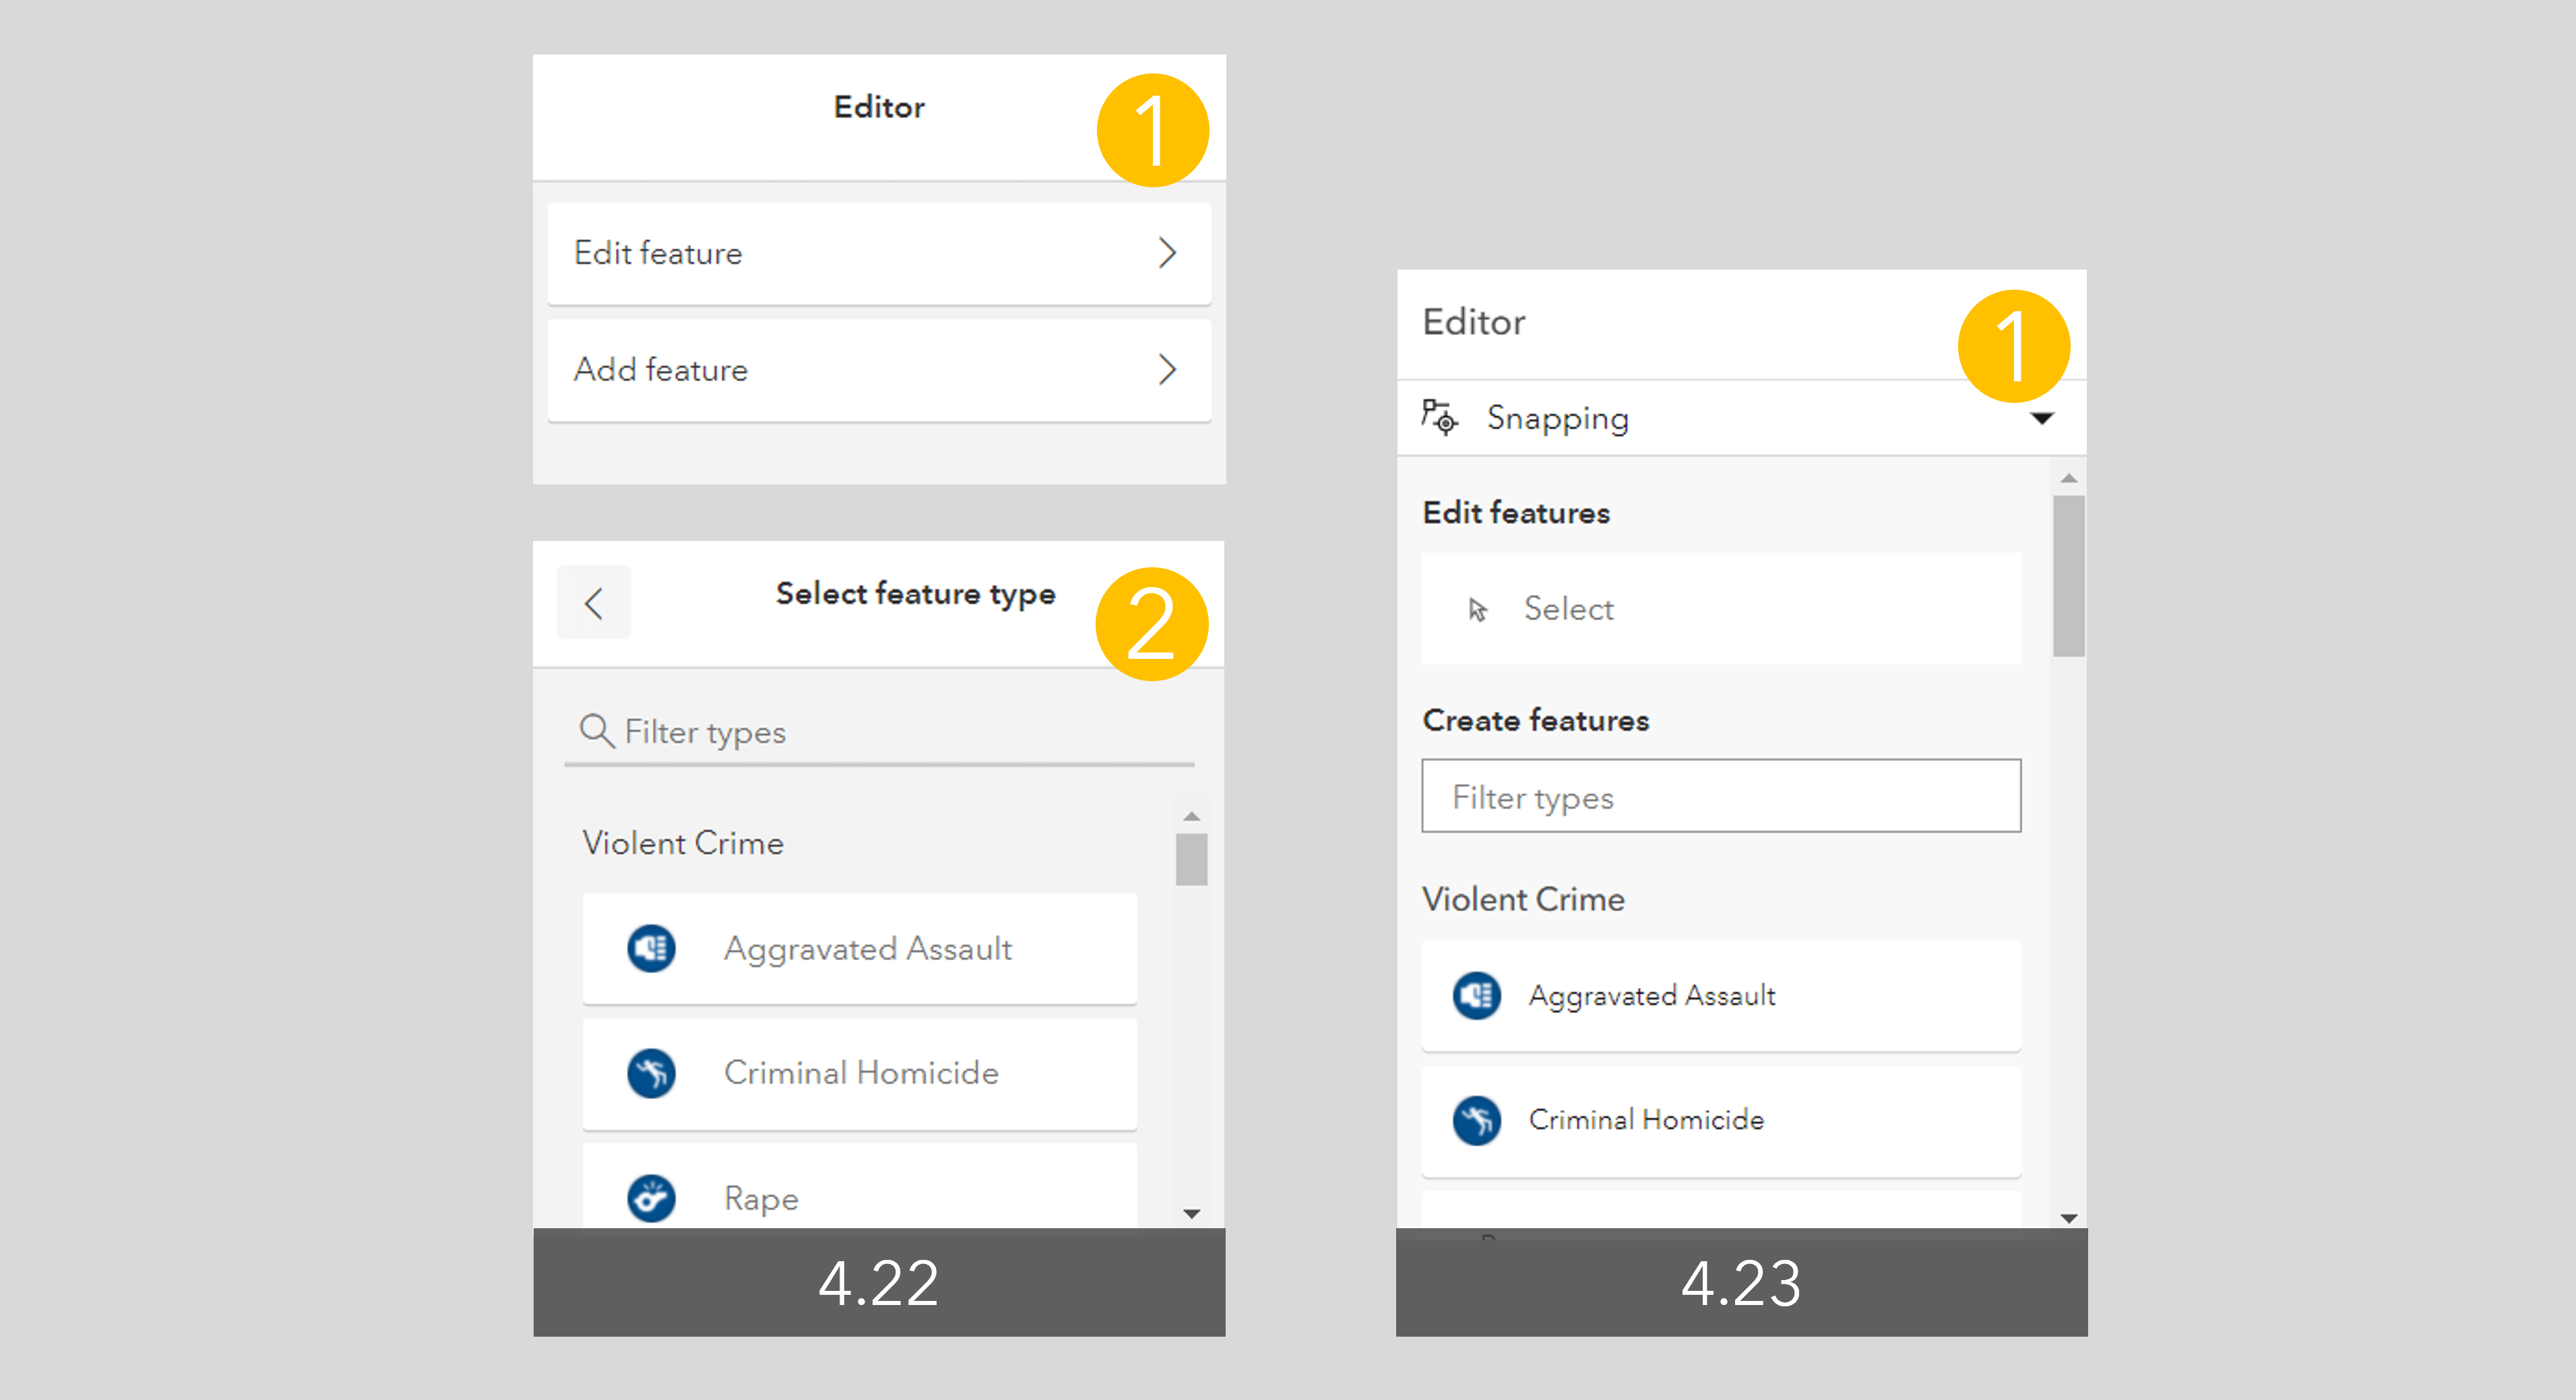
This release introduces significant changes to the Editor widget which are aimed at increasing end user productivity when editing and offering an overall better user experience. The updated UI streamlines the process for creating and updating features while integrating Snapping Controls. The Editor also includes support for batch (continuous) feature creation. It is now possible to create multiple features of the same type at once. When doing so, a form displays for each newly-created feature and attributes can be updated as needed.
These updates are just a few of improvements on the Editor roadmap, and many more are planned for upcoming releases.
Feature Form
Support for Contingent Attribute values
The FeatureForm widget now has support for contingent attribute values. Contingent values are a data design feature (introduced in ArcGIS Pro 2.4) that restricts the valid field inputs in one field based off the field value chosen in another field. This helps enforce data integrity in editing workflows.
Calculate the value of a field using Arcade
In addition to controlling the visibility of fields and whether a field is required via Arcade, this API update allows you to calculate the value for a field via an Arcade expression. You can also control whether a field is editable via an Arcade expression.
FeatureTable bells and whistles
The FeatureTable widget had some significant updates this release:
Sort multiple fields, with control over what column gets prioritized over others when the table initially displays. The image below shows the second column, “Enrollment”, having a higher sort priority than the “School Name.”

When rows are selected in the table, two new menu items will be displayed: Show selected records and Zoom to selection. These can also be called programmatically.
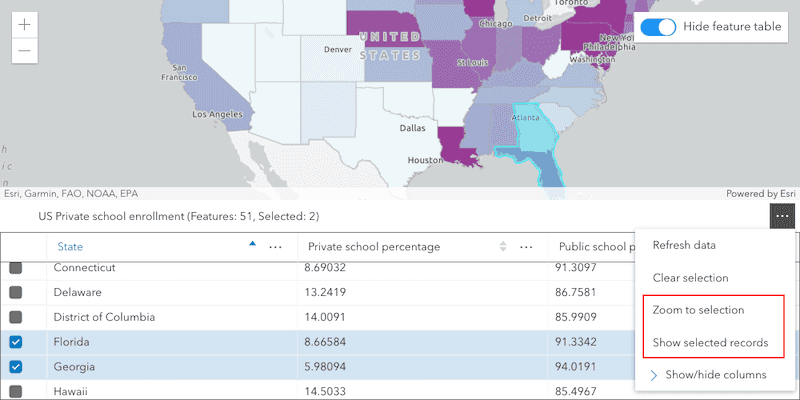
The FeatureTable will automatically refresh when its associated layer has been updated (but this can be changed).
Hide or show menu items for columns.
Creating, visualizing, and saving routes
The newly introduced RouteLayer allows you to analyze, visualize and share routes. A RouteLayer can consist of stops, barriers, and directions (if solved). RouteLayers can be loaded from ArcGIS Online or Enterprise or you can create one from scratch.
At a future release, the RouteLayer will be integrated with the Directions widget. This will allow new RouteLayers to be created and saved from the Directions widget, as well as allowing the Directions widget to open and even update existing RouteLayers.
Checkout the Intro to RouteLayer sample to see it in action.
Handy mapping improvements
MapView.hitTest returns all intersecting features
MapView.hitTest() now returns all features that intersect the specified screen coordinates from FeatureLayer, CSVLayer, GeoJSONLayer, StreamLayer, GeoRSSLayer and KMLLayer. Previously, it only returned the topmost feature from a layer.
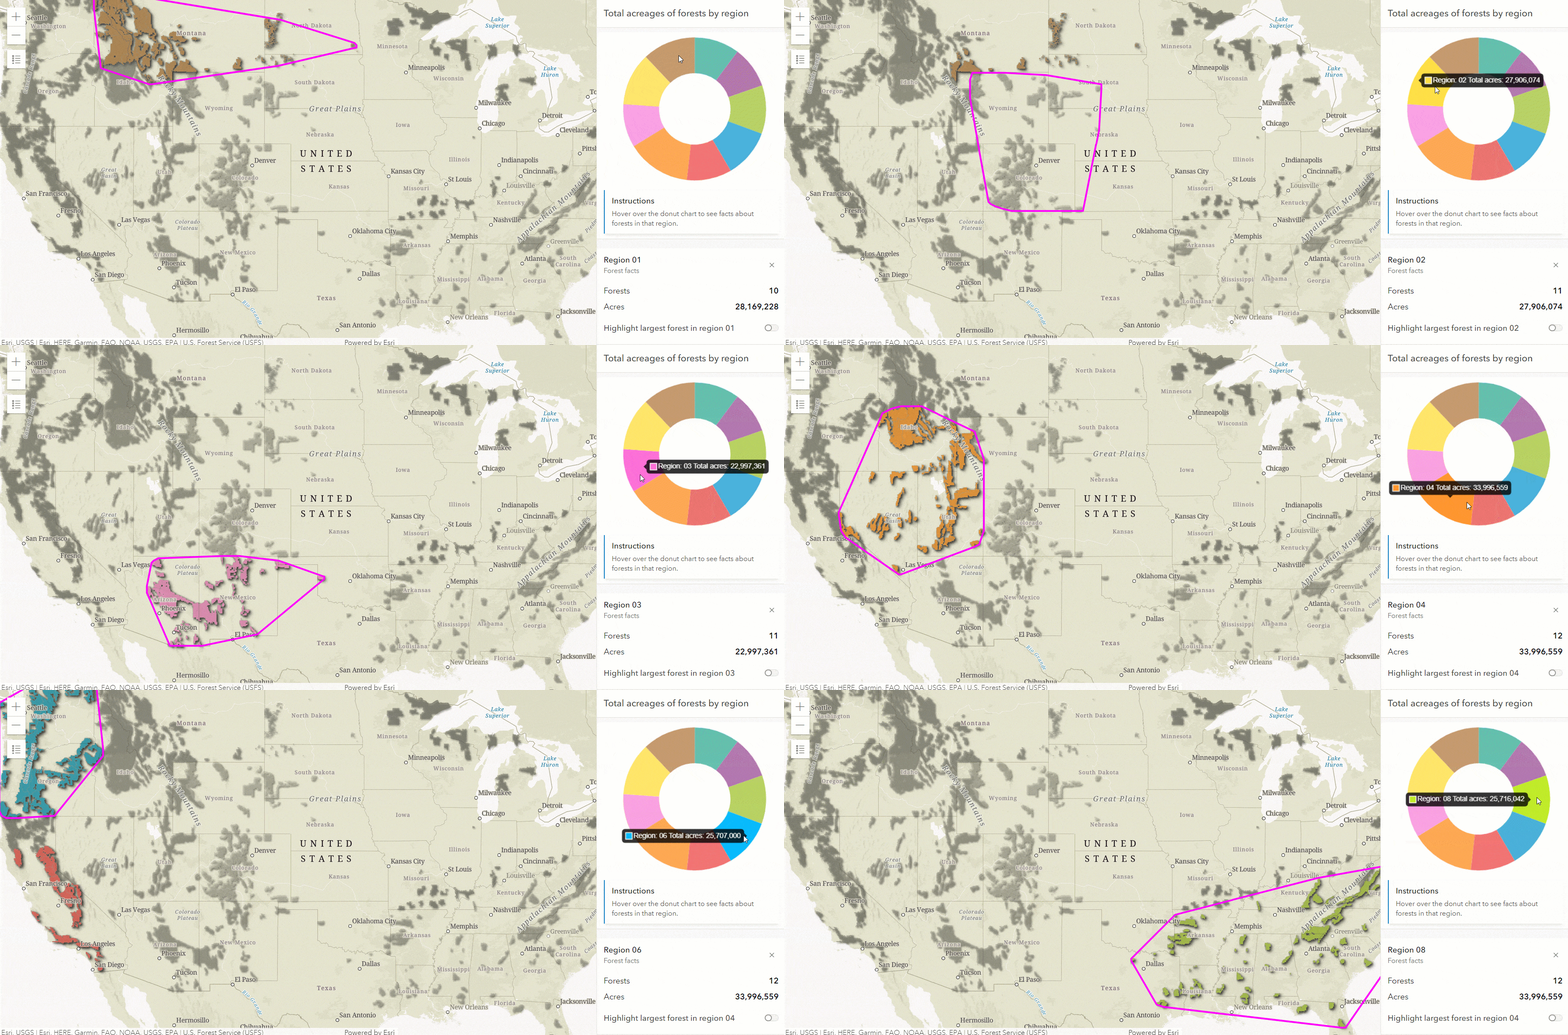
Version 4.23 added support for aggregate spatial statistics. A statistics query can now return an aggregate extent, center or convex-hull geometries encompassing features when the statistics are grouped by fields. The aggregate geometries will return with result features and can be accessed via the graphic’s aggregateGeometries property. Check out the Aggregate spatial statistics sample to see it in action.
Create your own CIMSymbol using better documentation
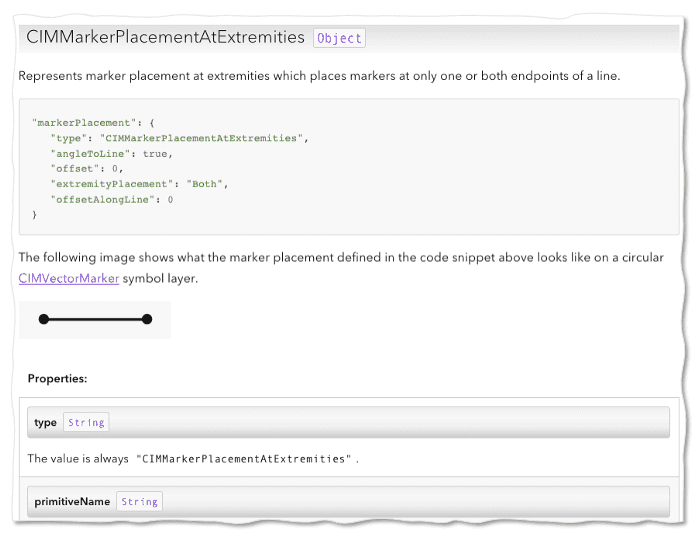
In addition to the improved support for CIMSymbols, we have updated the CIMSymbol documentation so that it is more straight-forward for you to create your own CIM symbols. As opposed to using the CIM specification on GitHub, you can simply use the API reference. All supported properties from the CIM spec are documented, along with images and code snippets.
Increased security with OAuth authentication
Prior to this version, the one-step OAuth authentication flow was used by default which could potentially cause problems if the token was leaked or stolen. To enable tighter security and follow the recommendations in the OAuth 2.0 Security Best Current Practices specifications, OAuth authentication now defaults to using short-lived access tokens generated via two-step with Proof Key for Code Exchange (PKCE) flow. This will be the default behavior for applications using the default page redirection for OAuth sign-in.
This update should be transparent with no changes needed by the developer if popups are not used for signing in and the application accesses ArcGIS Online or a version of ArcGIS Enterprise that supports PKCE. For more information about this update including how you can utilize two-step authentication with user sign in via a popup window, see the release notes.
Learn more
There is a lot more to learn about this release! For example, new utilities for watching properties, better default display of images in popups, significant performance improvements for large image services with multiple bands, and many more enhancements to help developers build powerful web mapping applications. Learn more by visiting the release notes and exploring the new samples.



Article Discussion: