More than ever, governments around the globe are committing to advancing social equity along the lines of race, ethnicity, gender, disability status, sexual orientation, and more. They recognize that policies have systematically denied certain groups the resources and infrastructure needed to thrive. Furthermore, they seek to correct that by optimizing interventions to address disproportionate burdens. They recognize that by transforming policies, practices, and procedures to address systemic inequities, everyone benefits.
At the forefront of this work is Race Forward’s Government Alliance on Race and Equity (GARE) — a network of over 400 city, county, and state government jurisdictions across the U.S. working to advance racial equity. The change-makers within this network are racial equity leaders committed to innovating, implementing, and sharing emerging best practices for advancing racial equity.
Over the past year, Esri had the honor to work with GARE and five of their member jurisdictions to collaborate on a new set of spatial decision making tools for governments seeking to locate and dismantle inequities in their communities. The result: the new ArcGIS Social Equity Analysis solution.
*This 3-part blog series will cover the story behind the Social Equity Analysis solution, the solution capabilities, and tips on how to enhance your analysis.
Partnering with Racial Equity Leaders
Our government partners hailed from the City of San Antonio, TX, Milwaukee County, WI, Durham, NC, Fairfax County, VA, and the City and County of Denver, CO. The goal of this partnership was to develop a new geospatial solution that directly addressed the needs of these government leaders working to advance equity in their communities. The representatives from these jurisdictions included a mix of racial equity leaders and GIS/data analysts, intending to bring these two (often siloed) disciplines into conversation with one another to brainstorm solutions.
Over nearly a year and a half, our teams met monthly to discuss the experiences, challenges, insights, and best practices from our partners that would ultimately inform the tools we built together.

Addressing Common Racial Equity Challenges
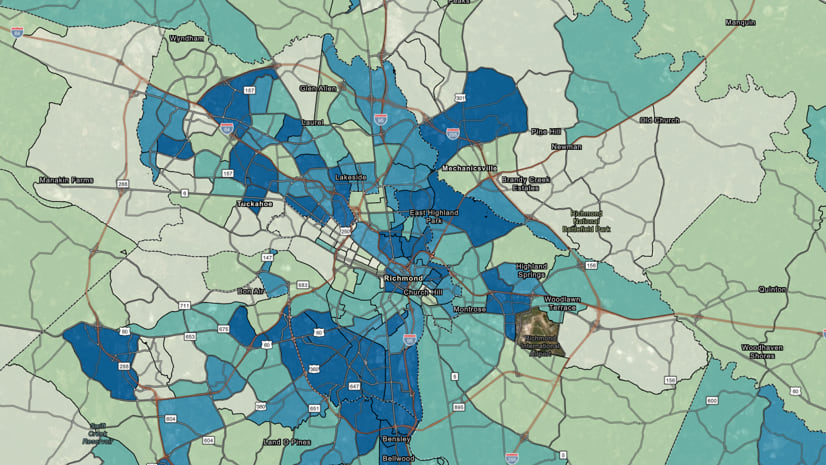
Everyone in our working group strongly agreed that understanding must proceed action. To make the best decisions, governments need first to visualize and understand where inequitable community conditions, actions, and outcomes exist within their jurisdictions. Interventions to increase equity would only be successful when decision-makers had a strong understanding of current community conditions and where burdens are greatest for specific populations.
Maps and data — when combined with robust community engagement — help decision-makers and communities develop this shared understanding of the distribution of benefits and burdens in their communities and address barriers to equity.
The Social Equity Analysis solution is built with these core principles and navigates users through a 5-step process. The process includes identifying a focus area of interest or question at hand, an evaluation of which communities are disproportionately impacted or burdened by it, and where to target interventions to address disproportionate impacts or outcomes:
- Evaluate community conditions and actions of interest (What is it that you seek to analyze? What decision is before you? How are assets, resources, harms, impacts, or outcomes distributed across my community?)
- Understand community characteristics & demographics (How are populations of interest distributed across my community?)
- Create an Equity Analysis Index (How are the community conditions and actions of interest experienced differently across the community and among the populations of interest?)
- Optimize interventions (Where should we target interventions or actions to improve equitable impact or outcomes?)
- Share your results (How can I ground-truth this analysis with the communities most impacted?)
The next blog post in this series will dig deeper into these workflows.
"It's truly exciting that this partnership has resulted in the creation of a place-based tool that centers racial equity. Our racial equity experts, working inside government, provided key considerations toward building a tool to visualize complex on-the-ground decisions. This new tool simultaneously provides greater rigor, functionality, flexibility, and sophistication to our shared desire to advance racial equity."
Harnessing Collective Wisdom
Over the course of our discussions, we learned that many of our partners already had Racial Equity Action Plans that included indicators used to understand community conditions and measure progress. However, we recognized that some jurisdictions just starting out with this kind of analysis may not have gotten that far. Some may struggle with what indicators to choose for their community. We wanted all jurisdictions to benefit from the collective wisdom of the GARE cohort.
To address this, GARE surveyed the jurisdictions and incorporated the most commonly used indicators into the tool as the default. This way, jurisdictions just getting started on racial equity work could benefit from the emerging best practices from our partners. We made these indicators easily accessible for users to pull into their analyses, while also building in the flexibility to add or remove indicators based on your unique community.
Infusing the Science of Where
Social equity is inherently spatial. It is achieved when social identity (race, ethnicity, gender, disability, etc.) no longer determines one’s life outcomes; when everyone has what they need to thrive, no matter where they live. Geographic information is critical for understanding, planning, and acting to achieve social equity while engaging the people that matter most — community members — along the way.
This partnership sought to harness the collective wisdom and best practices of GARE leaders and infuse geospatial capabilities into a solution that addressed their most pressing challenges. The capabilities will be discussed in detail in the next blog post. Until then, for more information on the Social Equity Analysis solution, please visit www.esri.com/en-us/racial-equity/local-government/social-equity-analysis
Esri is grateful to our partners at:
- Race Forward,
- GARE,
- City & County of Durham,
- Fairfax County,
- Milwaukee County,
- City & County of Denver,
- City of San Antonio.
We are grateful for their recognition of the importance of location to racial equity and justice. Moreover, we appreciate our partners’ willingness to work alongside us to develop ArcGIS tools that further this work. We at Esri are committed to supporting users along this journey. We look forward to sharing more about this solution and connecting with our local government users at the GARE Annual Membership Meeting.


Article Discussion: