ArcGIS for SharePoint introduces GIS to Microsoft SharePoint. With ArcGIS for SharePoint, you can map, visualize, and organize the SharePoint data to get a general idea of what is happening on Earth and make informed decisions. ArcGIS for SharePoint lets you geotag and geosearch documents and data, add maps to the SharePoint pages, conduct spatial analysis such as Buffer/Drive time analysis and Infographics card, and much more.
Let’s get started with ArcGIS for SharePoint and walk through a step-by-step workflow that covers: adding a web part, configuring layers, applying basemap, the Search tool, geotag and geosearch, infographics cards, buffer/drive time analysis, sharing maps and configuration of the web part.
1. Create a new page on SharePoint.
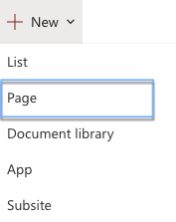
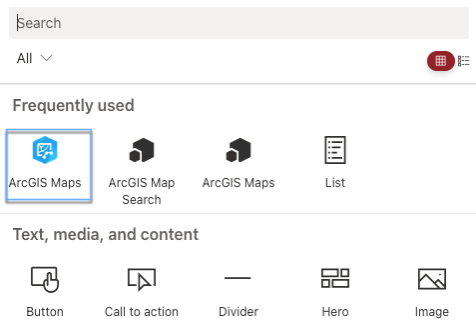
2. Add a new web part and choose ArcGIS Maps.
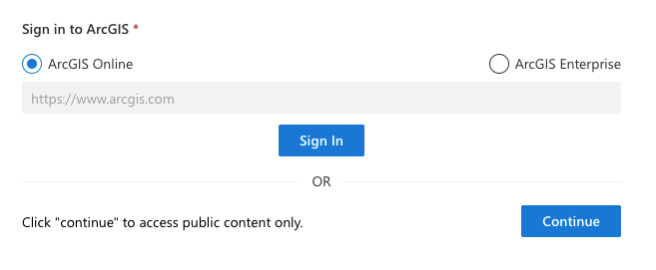
3. Sign in to ArcGIS or Continue to access public content only.
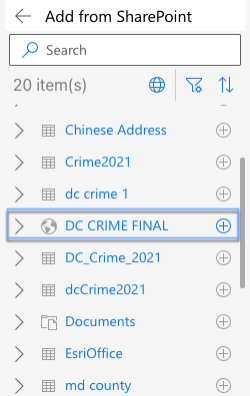
4. Add data from either one of these sources: SharePoint or ArcGIS.
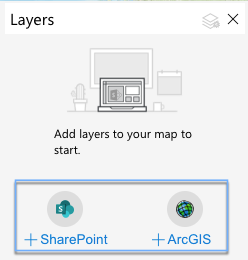
For example, choose crime incidents in Washington, D.C., in 2021 from the SharePoint list and click the Add button.
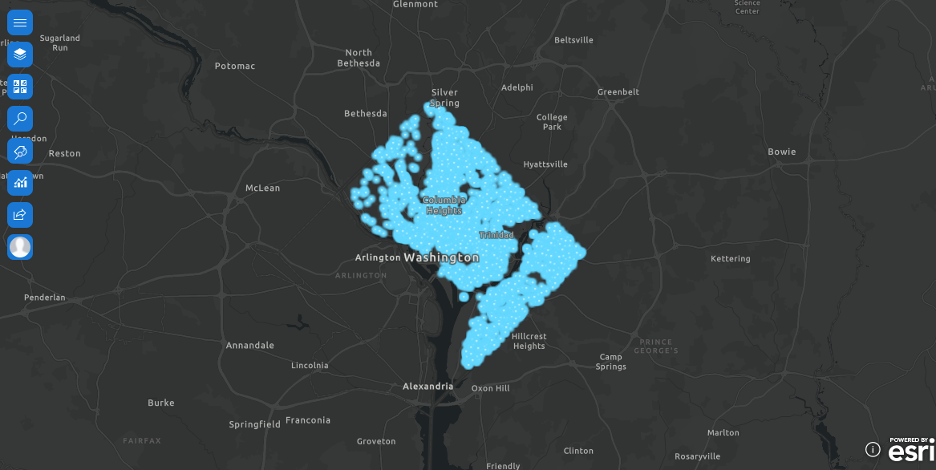
Crime incidents data is plotted on the map.
Configure layers
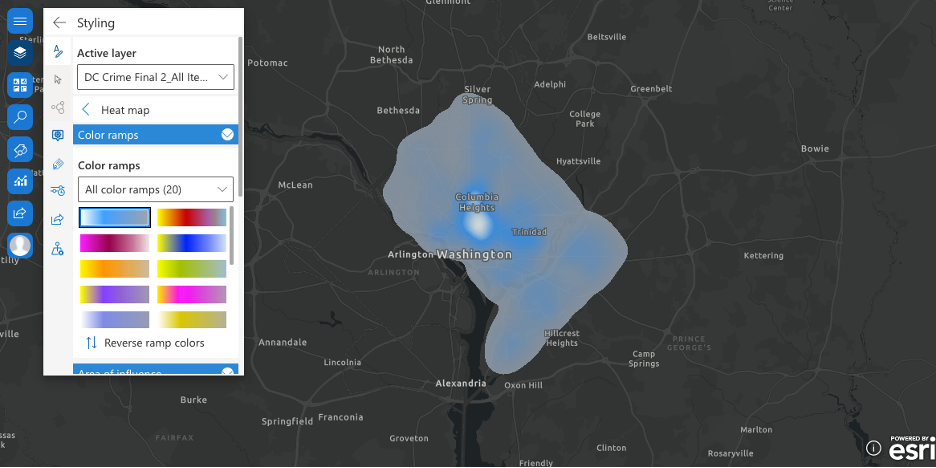
We can change the style of layer by choosing Styling in the Layer options widget. On the map below, we chose to visualize the crime incidents using Heat map to illustrate the density of crime incidents distributed in Washington, D.C. We can see that the crime incidents are mainly distributed in the center of this area. This will help people better understand crime incidents in this area and help policy makers determine where to assign officers based on the map.
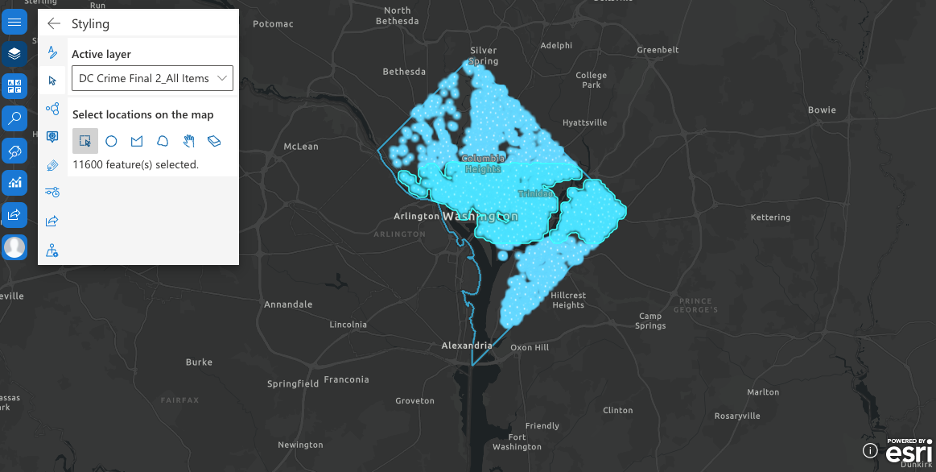
We can select certain features as our study area using Select features.
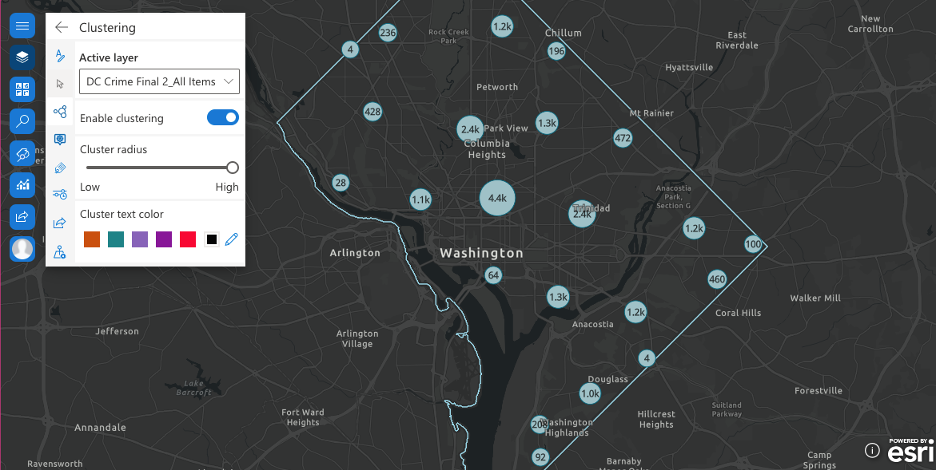
Crime incidents can be clustered by enabling Clustering. The size of the clusters will be adjusted based on the number of clustered features and cluster radius. We can also customize the cluster text color.
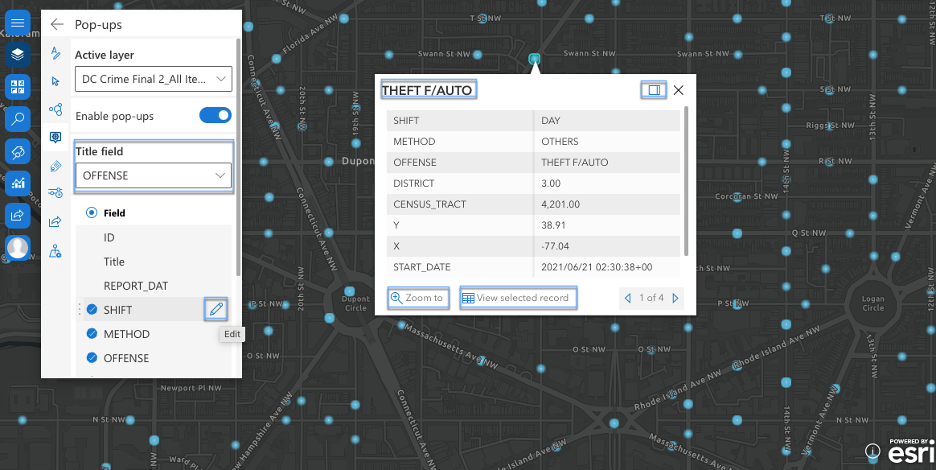
Enabling pop-ups gives more detailed information in the pop-up window when we click a specific feature. We can choose fields from the list to act as a title for the pop-up, for example, OFFENSE. We can also decide how much information to reveal in the pop-up window by selecting and deselecting the fields. Names of the fields can be changed when clicking the edit button. In the pop-up window, we can zoom to the feature we select, view a selected record, and dock the window.
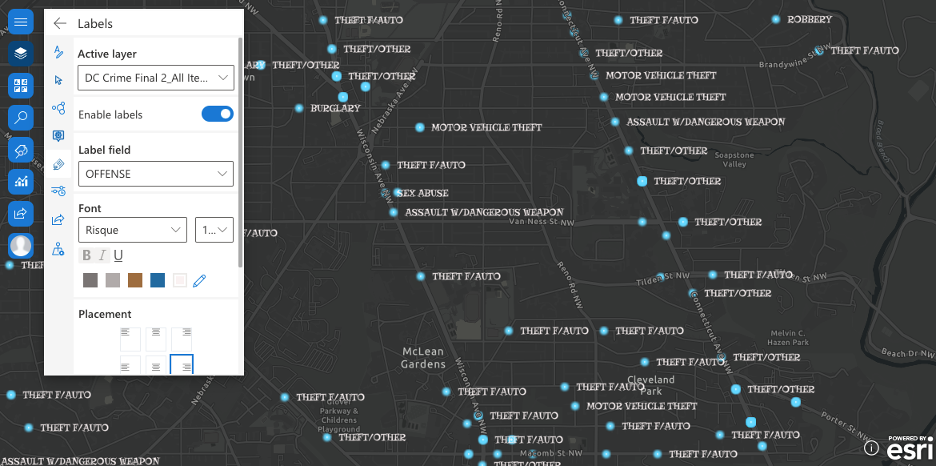
Labels can be added to reveal the detailed information of crime incidents. We label the points by displaying the OFFENSE type of each crime incident. We Enable labels and make OFFENSE as the Label field. We can customize the style of the labels by changing the Font, Placement, Visible range and Enable halo settings.
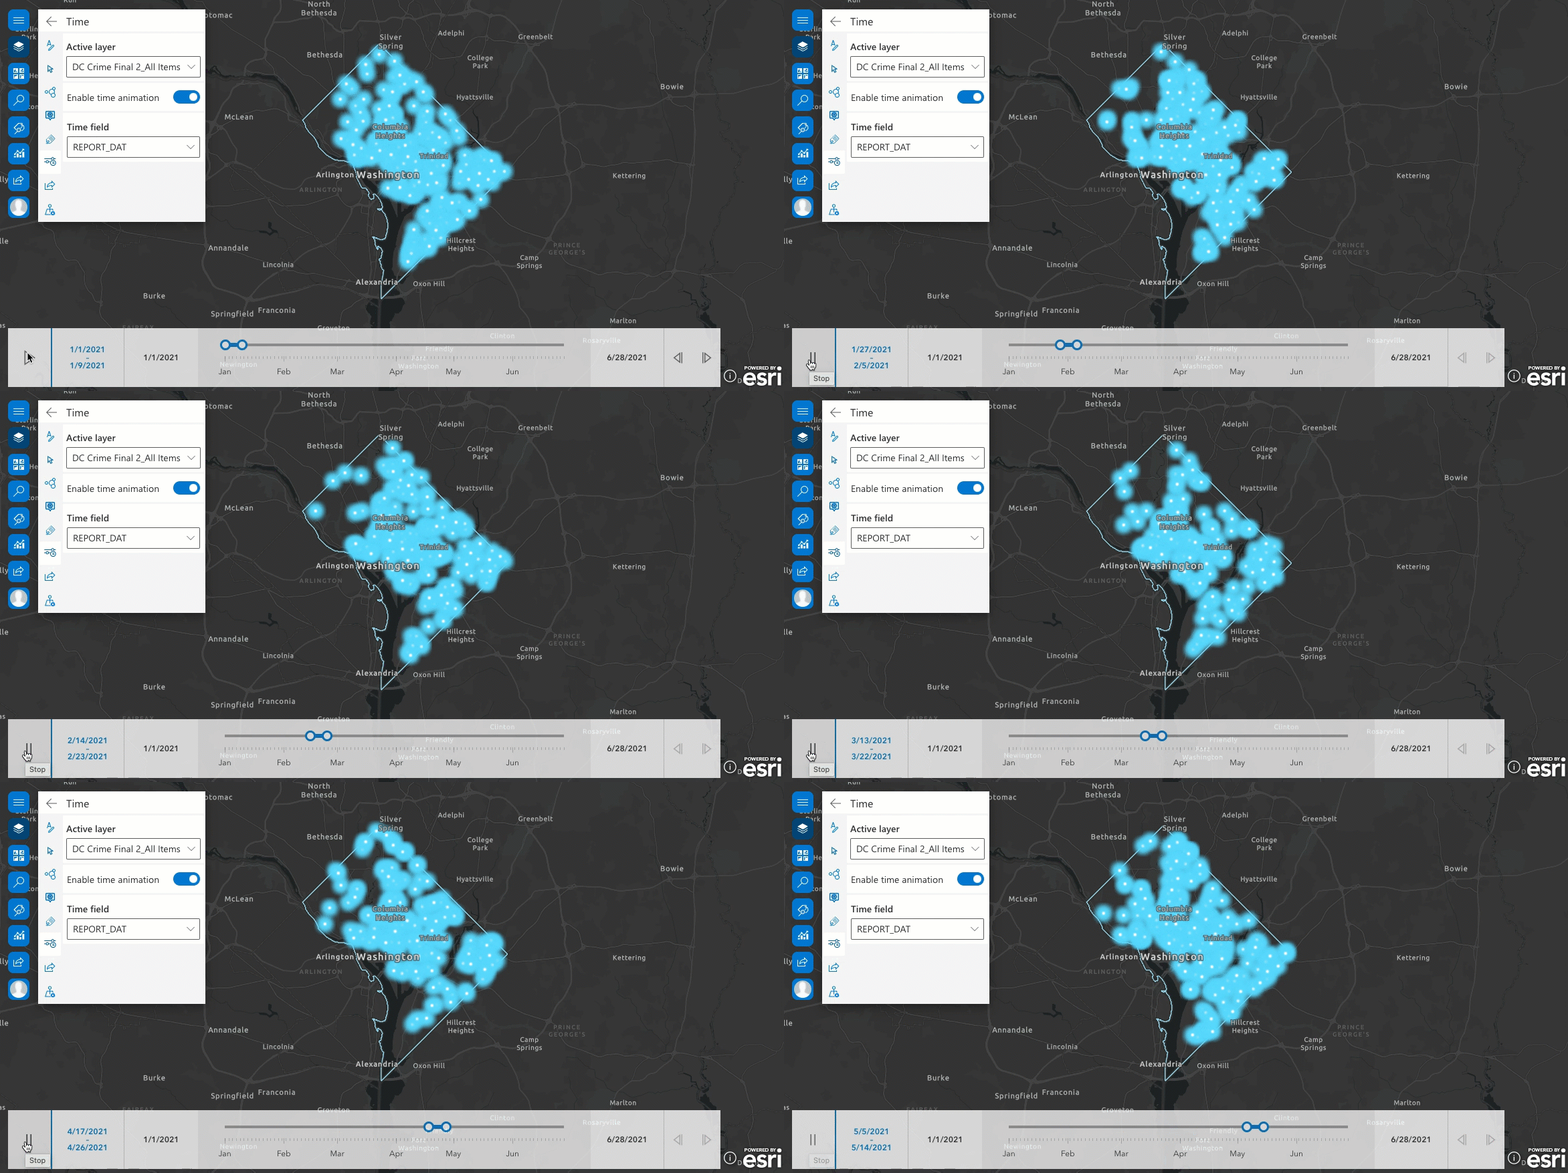
By enabling time animation, the map below reflects how crime incidents in Washington, D.C., were distributed as time went by in 2021. They are mainly distributed in the central and eastern part of Washington, D.C. We can see that there were fewer crime incidents happening in February, March, and April. Based on the temporal and spatial information, we can conduct spatial analysis on ArcGIS for SharePoint.
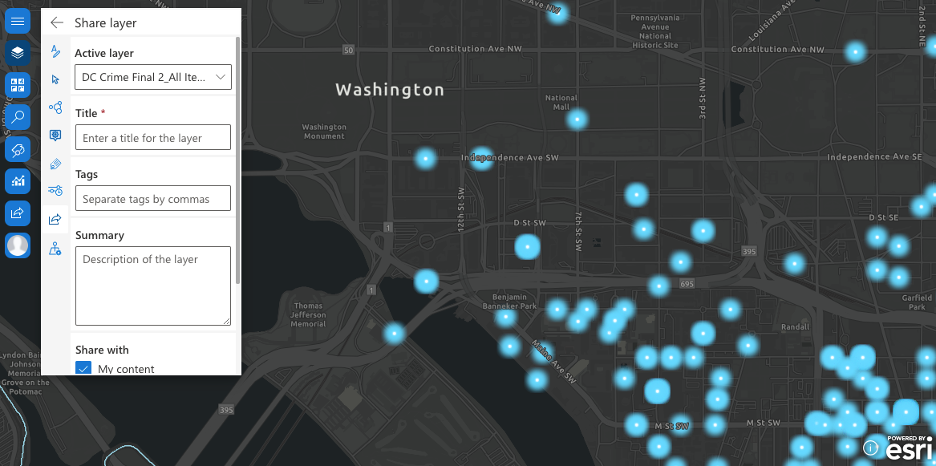
Using Share layer to select My content, Everyone (public) and My organization allows us to collaborate with others.
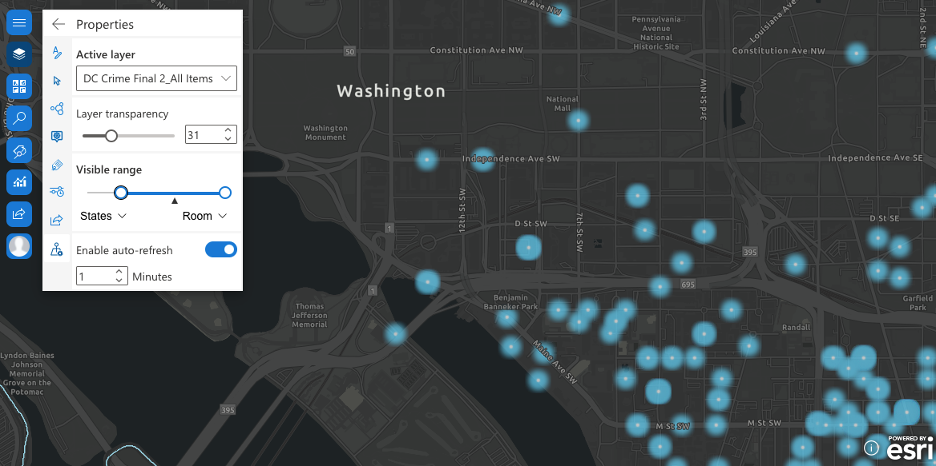
Change the properties of the active layer by adjusting the Layer transparency and Visible range settings and setting up Enable auto-refresh.
Apply basemap
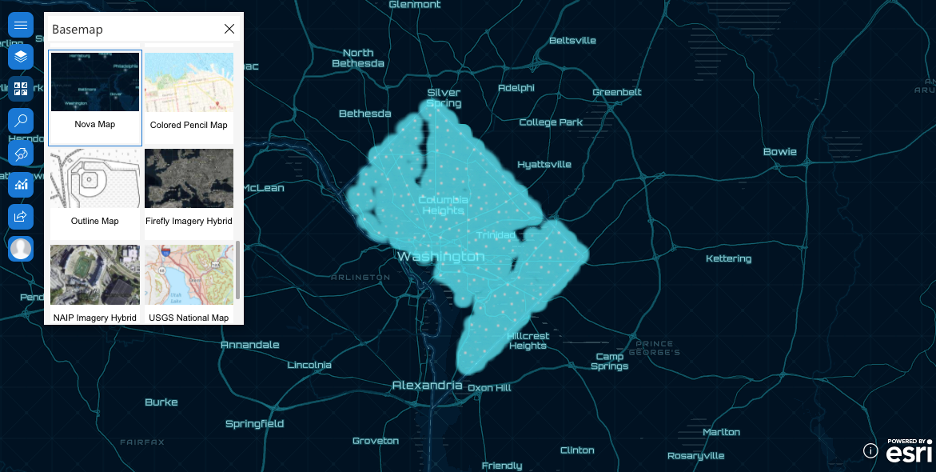
Various basemaps are available for us to customize into our own maps. For example, the Nova Map basemap is applied on the map below.
Search tool
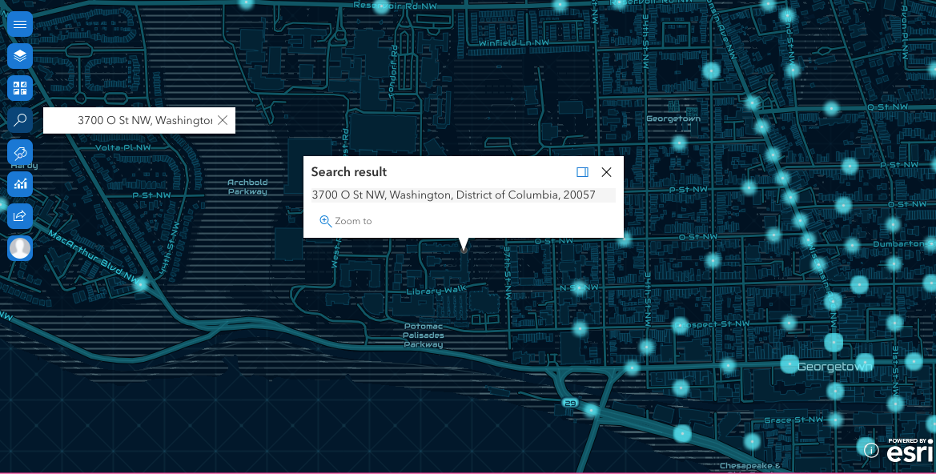
Using the Search tool, we can immediately zoom to a place and check the crime incidents around this area. For example, the image shows crime incidents around Georgetown University.
Geotag and geosearch
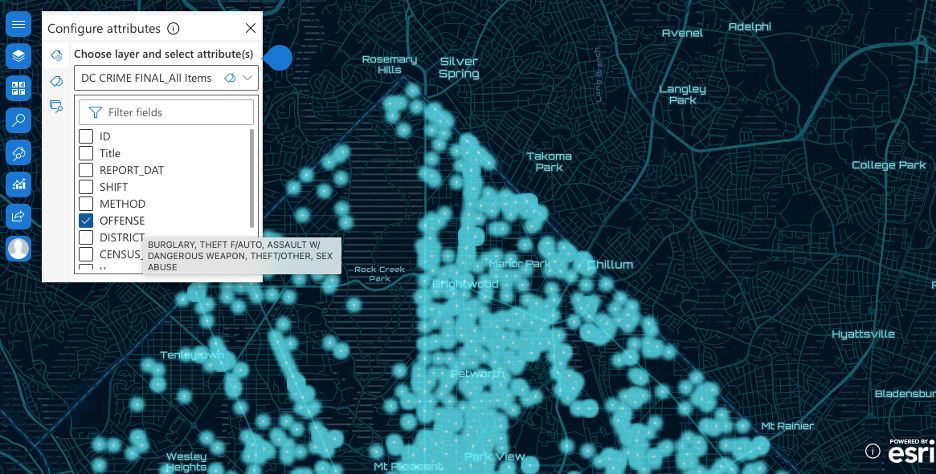
Geotag and geosearch are introduced in the 2021.2 release. We can geotag related crime documents to crime incidents with configured attributes and geosearch documents. This can help us organize files and documents and bring them to the map. First, we need to configure the attributes, for example, OFFENSE.
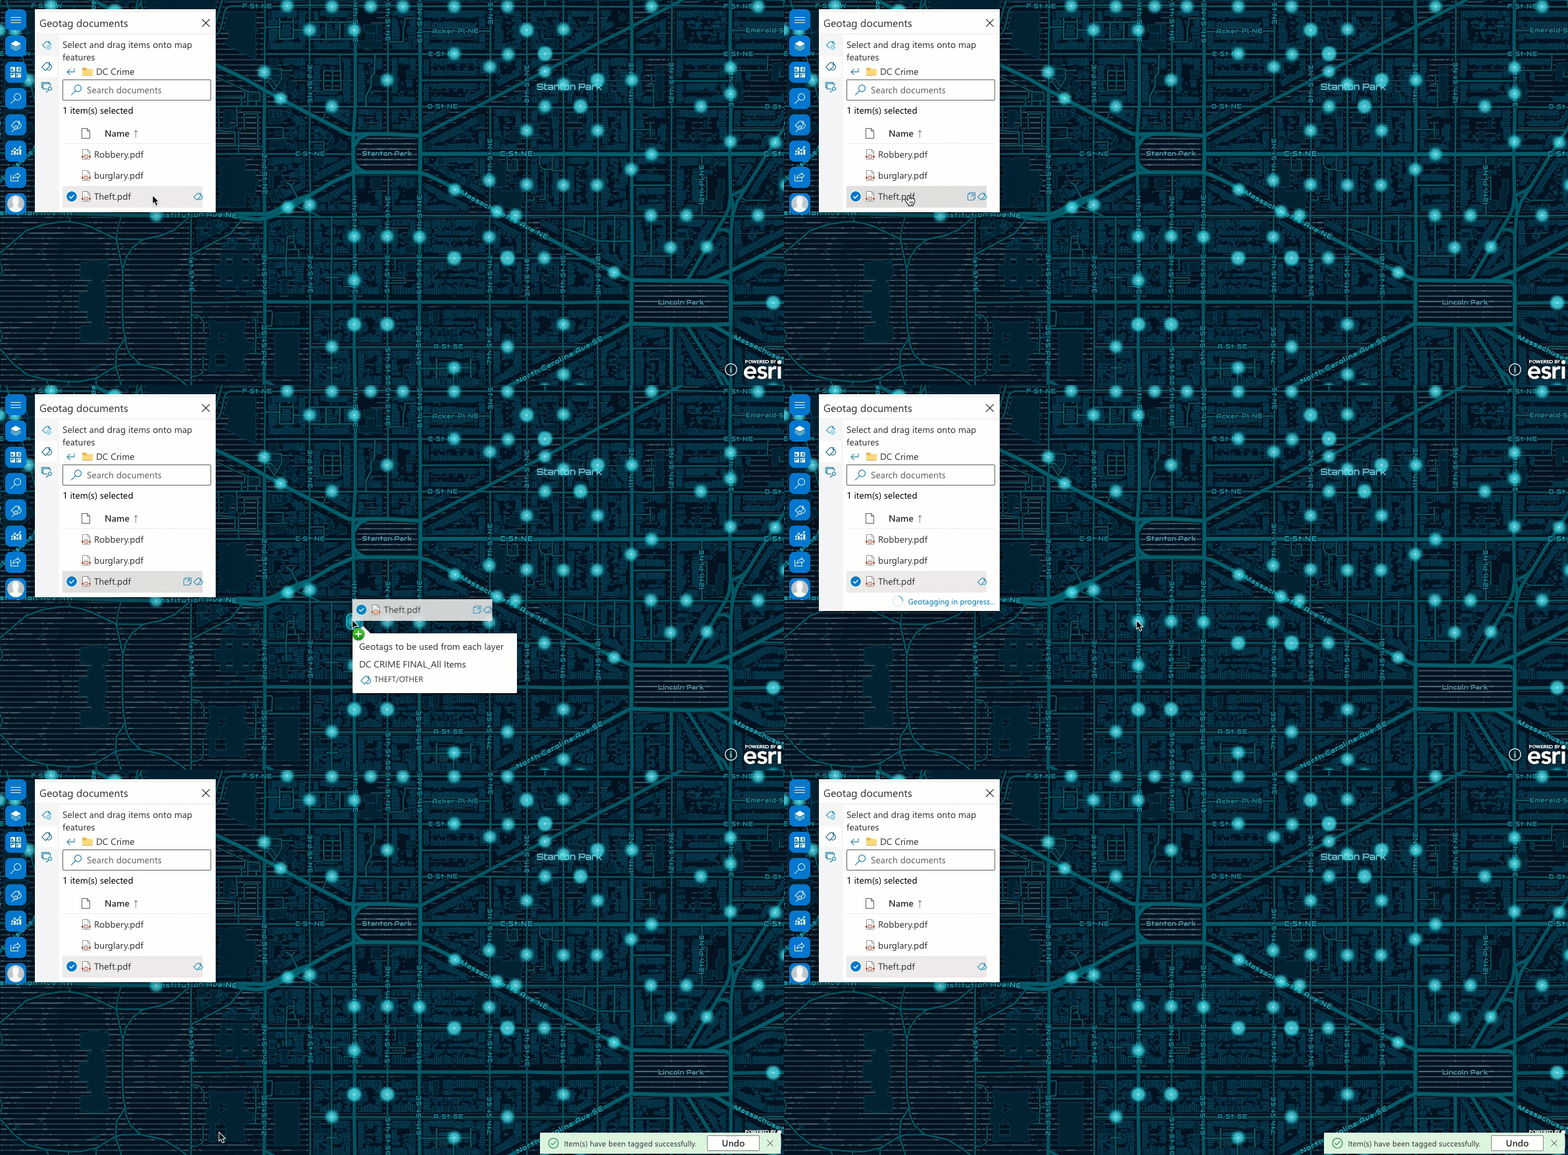
Then it’s time to geotag documents. We can drag the documents to the target feature. On the map below, the Theft law document is geotagged to the crime incidents OFFENSE types that are related to theft, such as motor vehicle theft, theft f/auto and more.
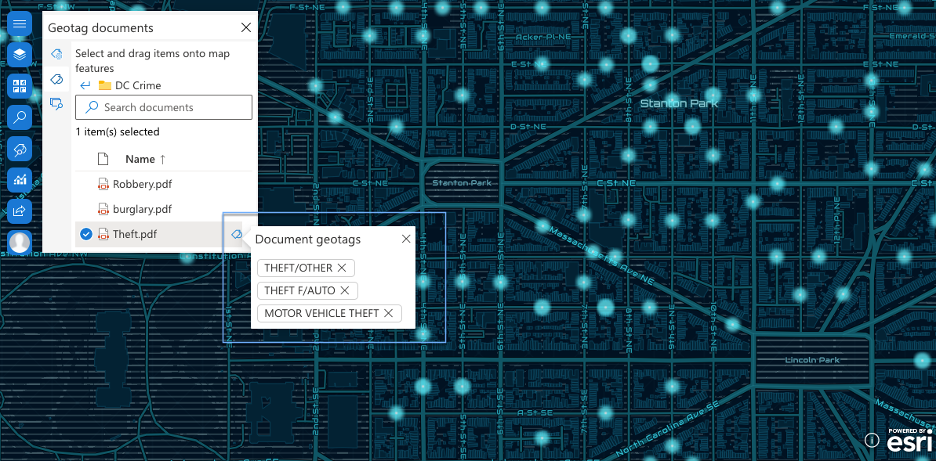
The geotagged attributes appear on the Document geotags pop-up window.
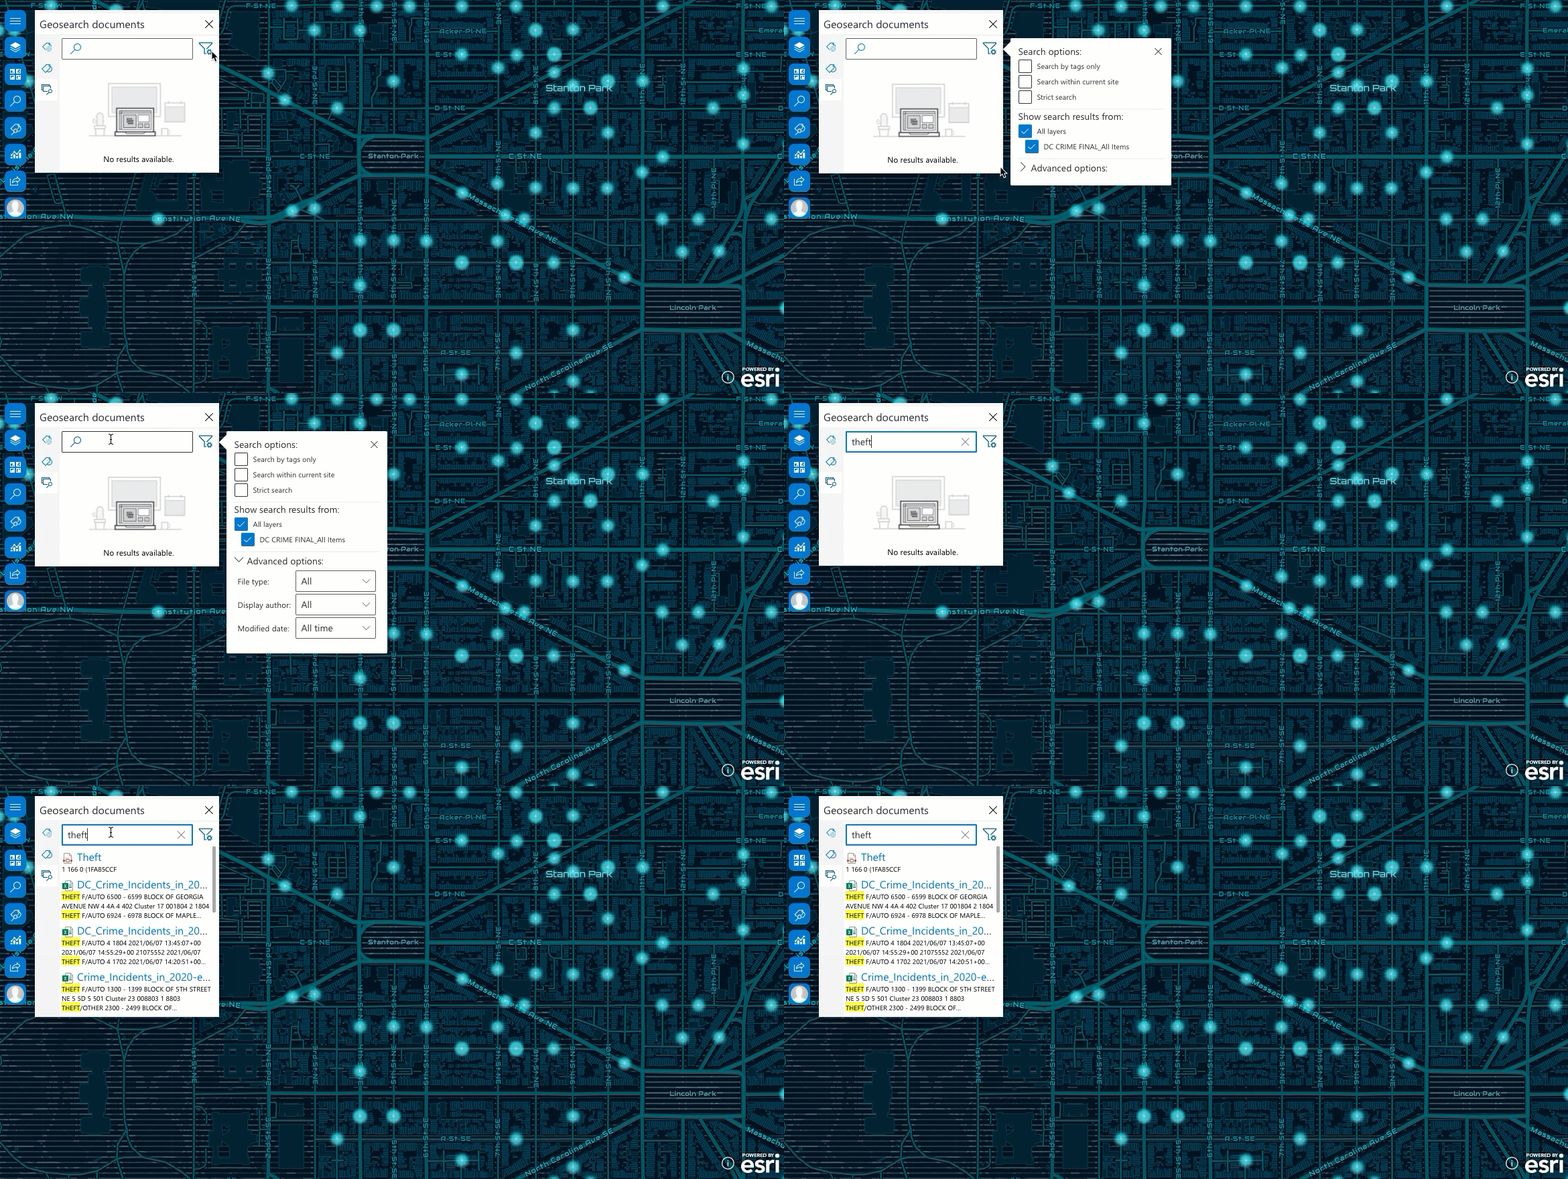
If we click the target feature, the geotagged document appears in Geosearch documents.
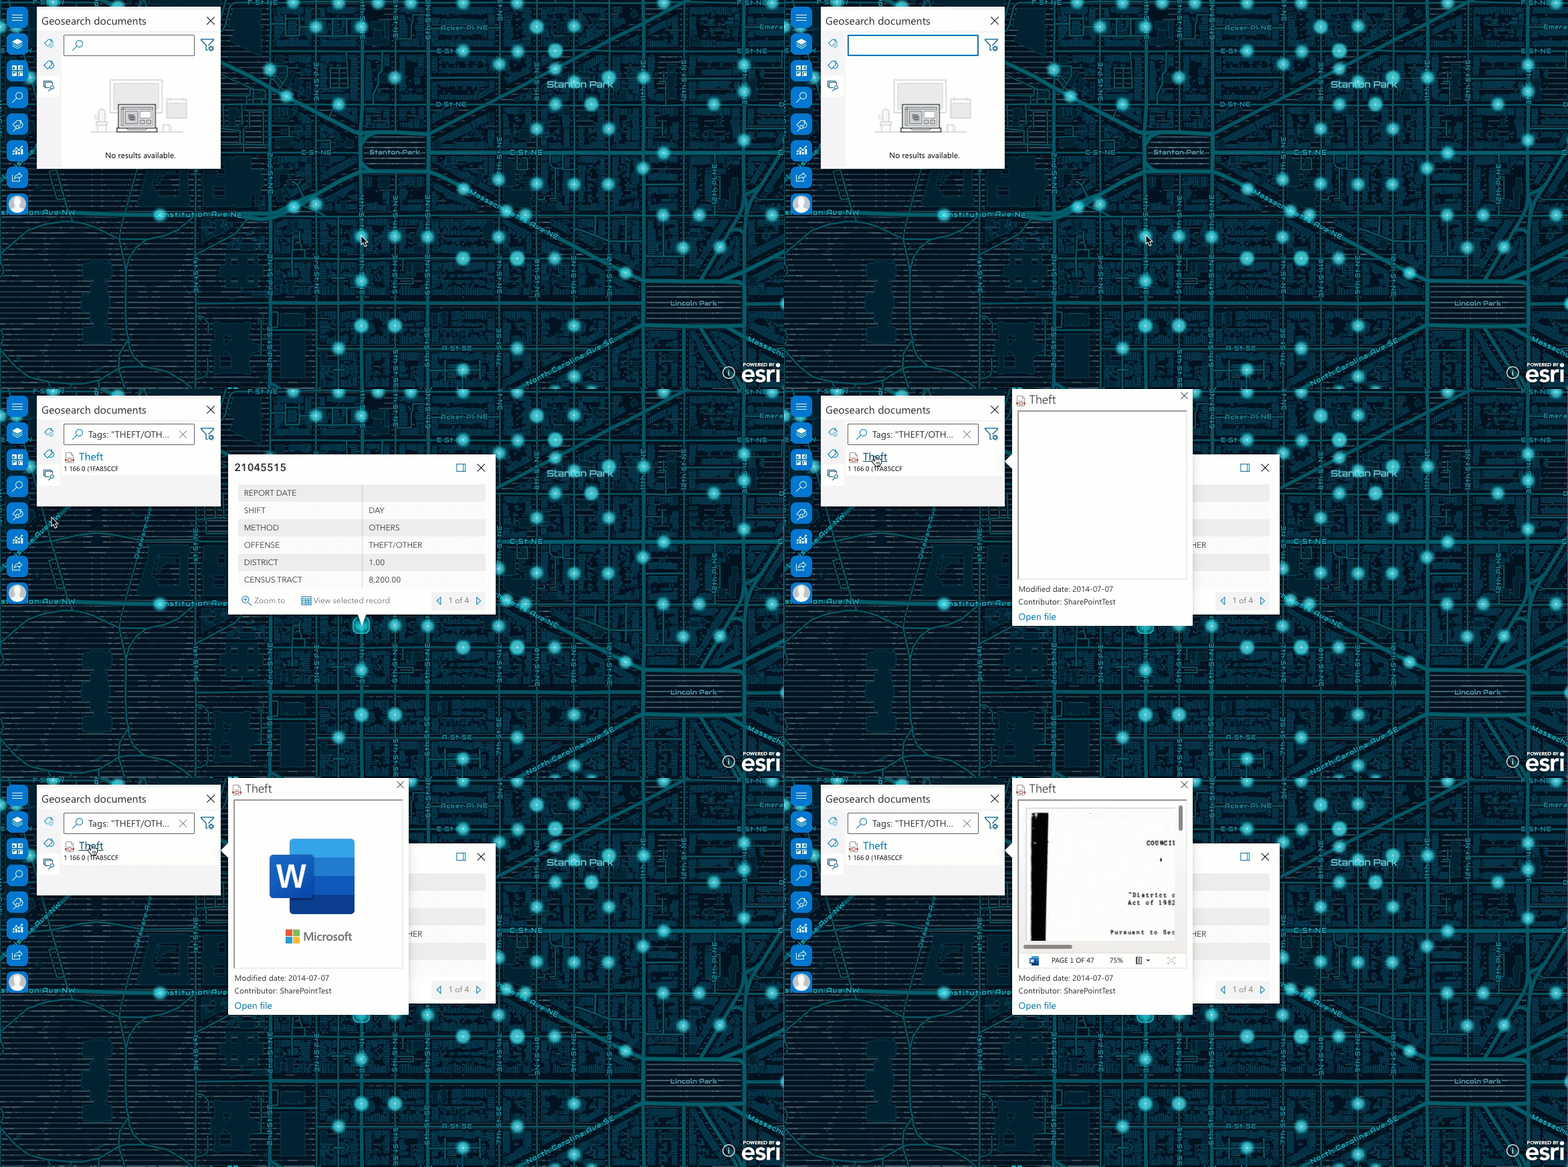
We can also search theft and get related documents results based on the filtering options such as Search by tags only and more.
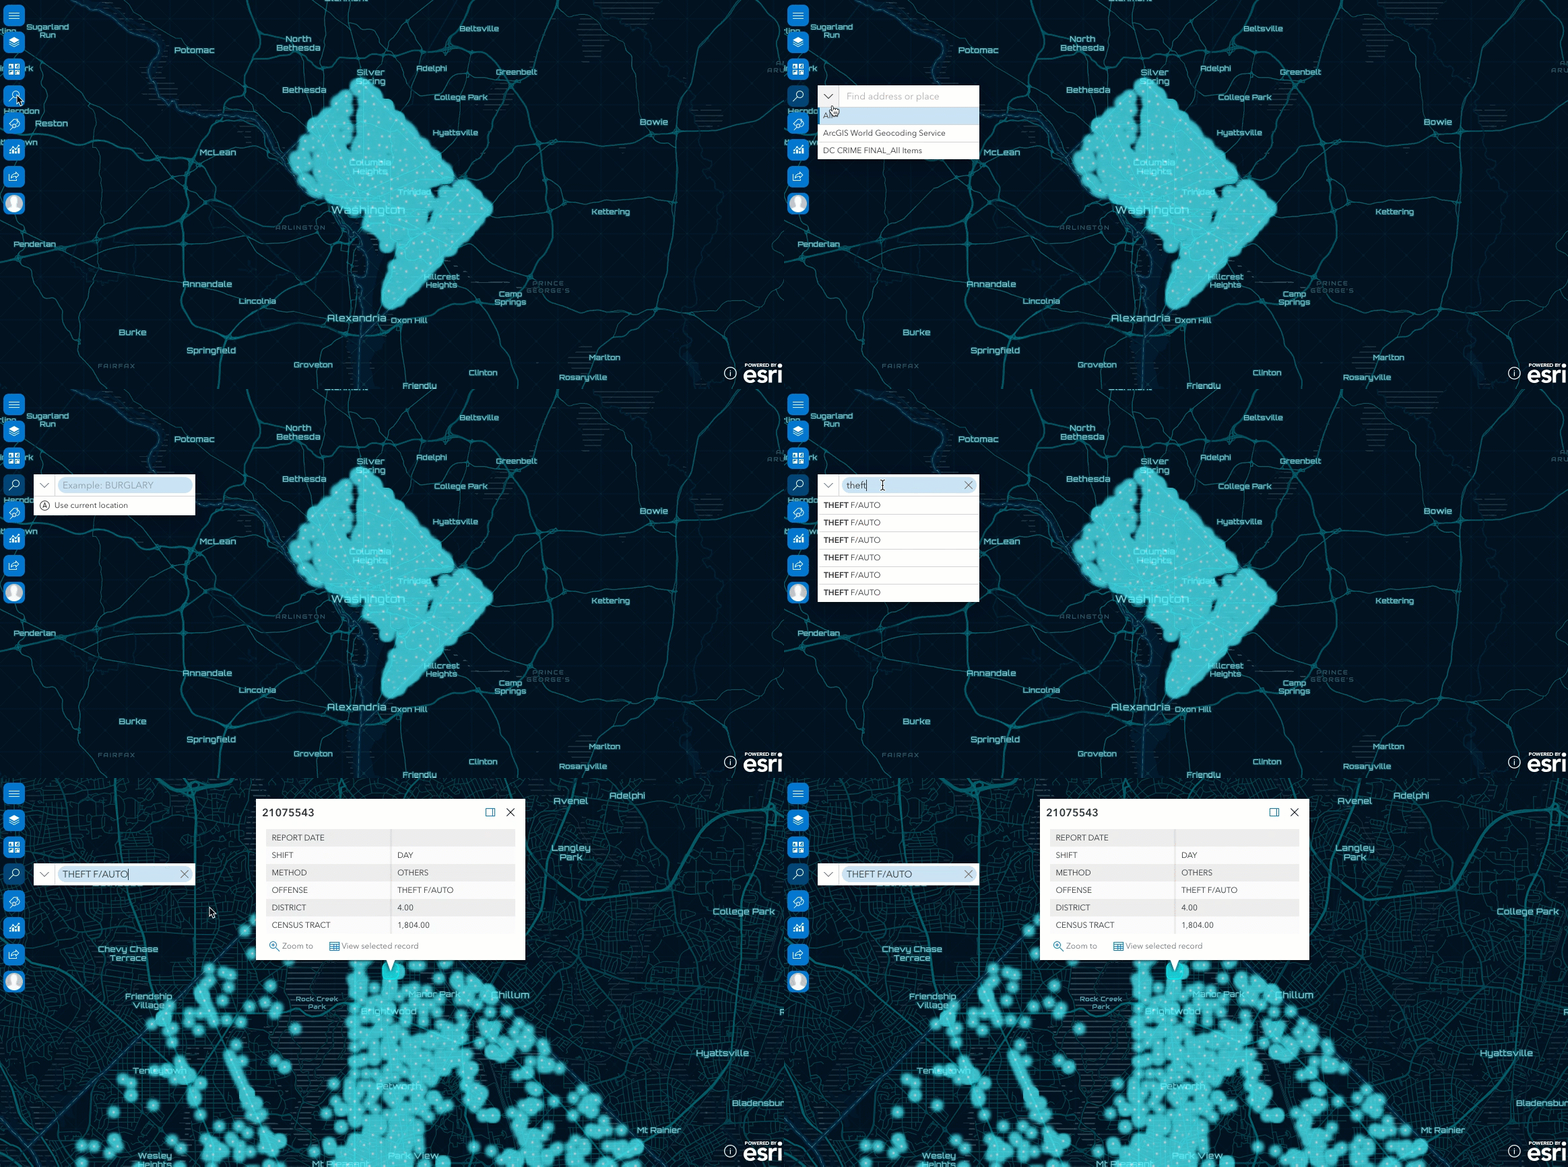
Since crime incidents OFFENSE type attributes have been configured, we can see the crime incidents data layer in the Search tool. If we choose the crime incidents layer from the drop-down list, type any OFFENSE attributes, and search, it will return the crime incidents with those attributes. Then we know which data points are theft OFFENSE types and how they are distributed in the Washington, D.C., area.
Infographics cards
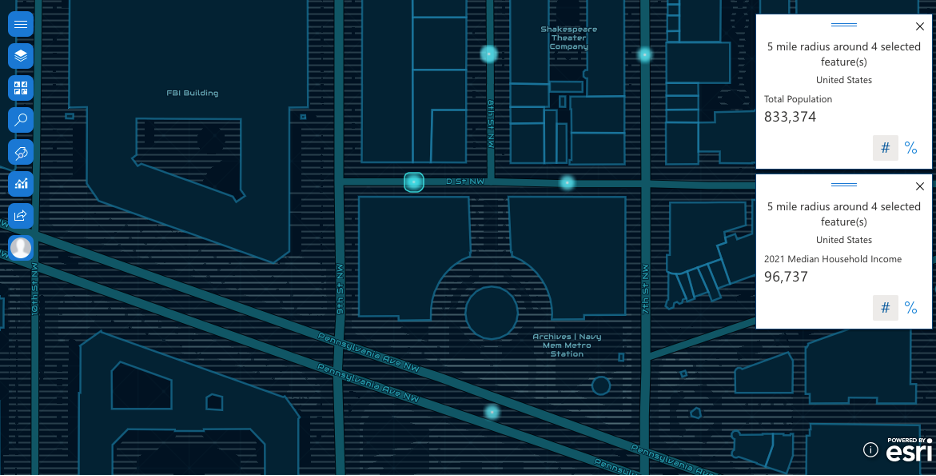
With Infographics card, variables such as population, income, age, and more can be added to the cards to display related information and number based on the map view. More importantly, we can conduct spatial analysis on the selected features. On the map below, we select four crime incidents on D St NW and make a 5 miles radius buffer analysis. This way, we get the result of 5 miles total population and 2021 median household income information around these features. These numbers help us dig more into spatial analysis.
Learn tips and tricks while using Infographics card.
Buffer/Drive time analysis
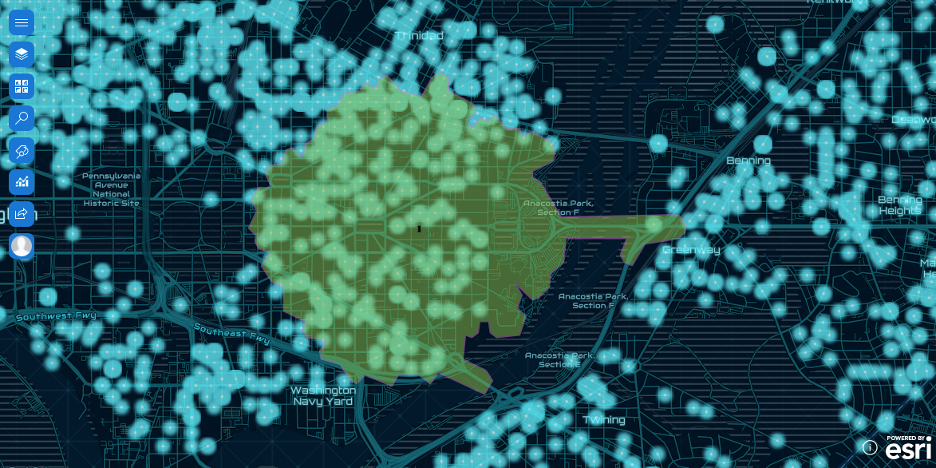
Buffer/drive time analysis is available in ArcGIS for SharePoint. For example, let’s see how many crime incidents happened within five minutes driving time from Lincoln Park.
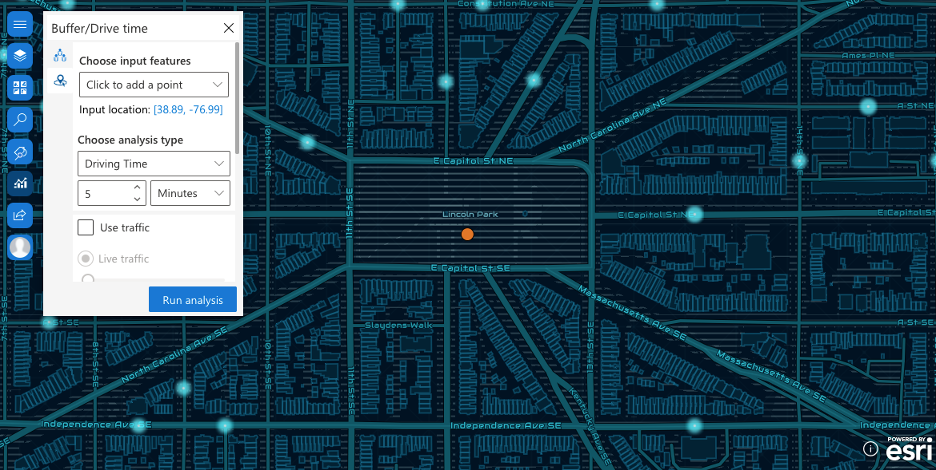
The image shows the result of the areas within five minutes driving time in green. We can see how the crime incidents are distributed around this area.
Share a map to ArcGIS
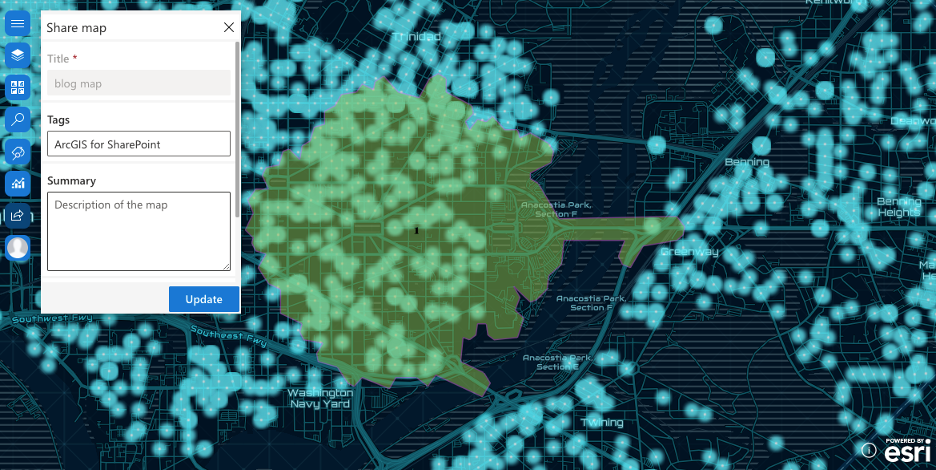
We’re now ready to share our work with the public, our content, and our organization. If we already have shared the map, we can update the map with any changes.
Web part configuration
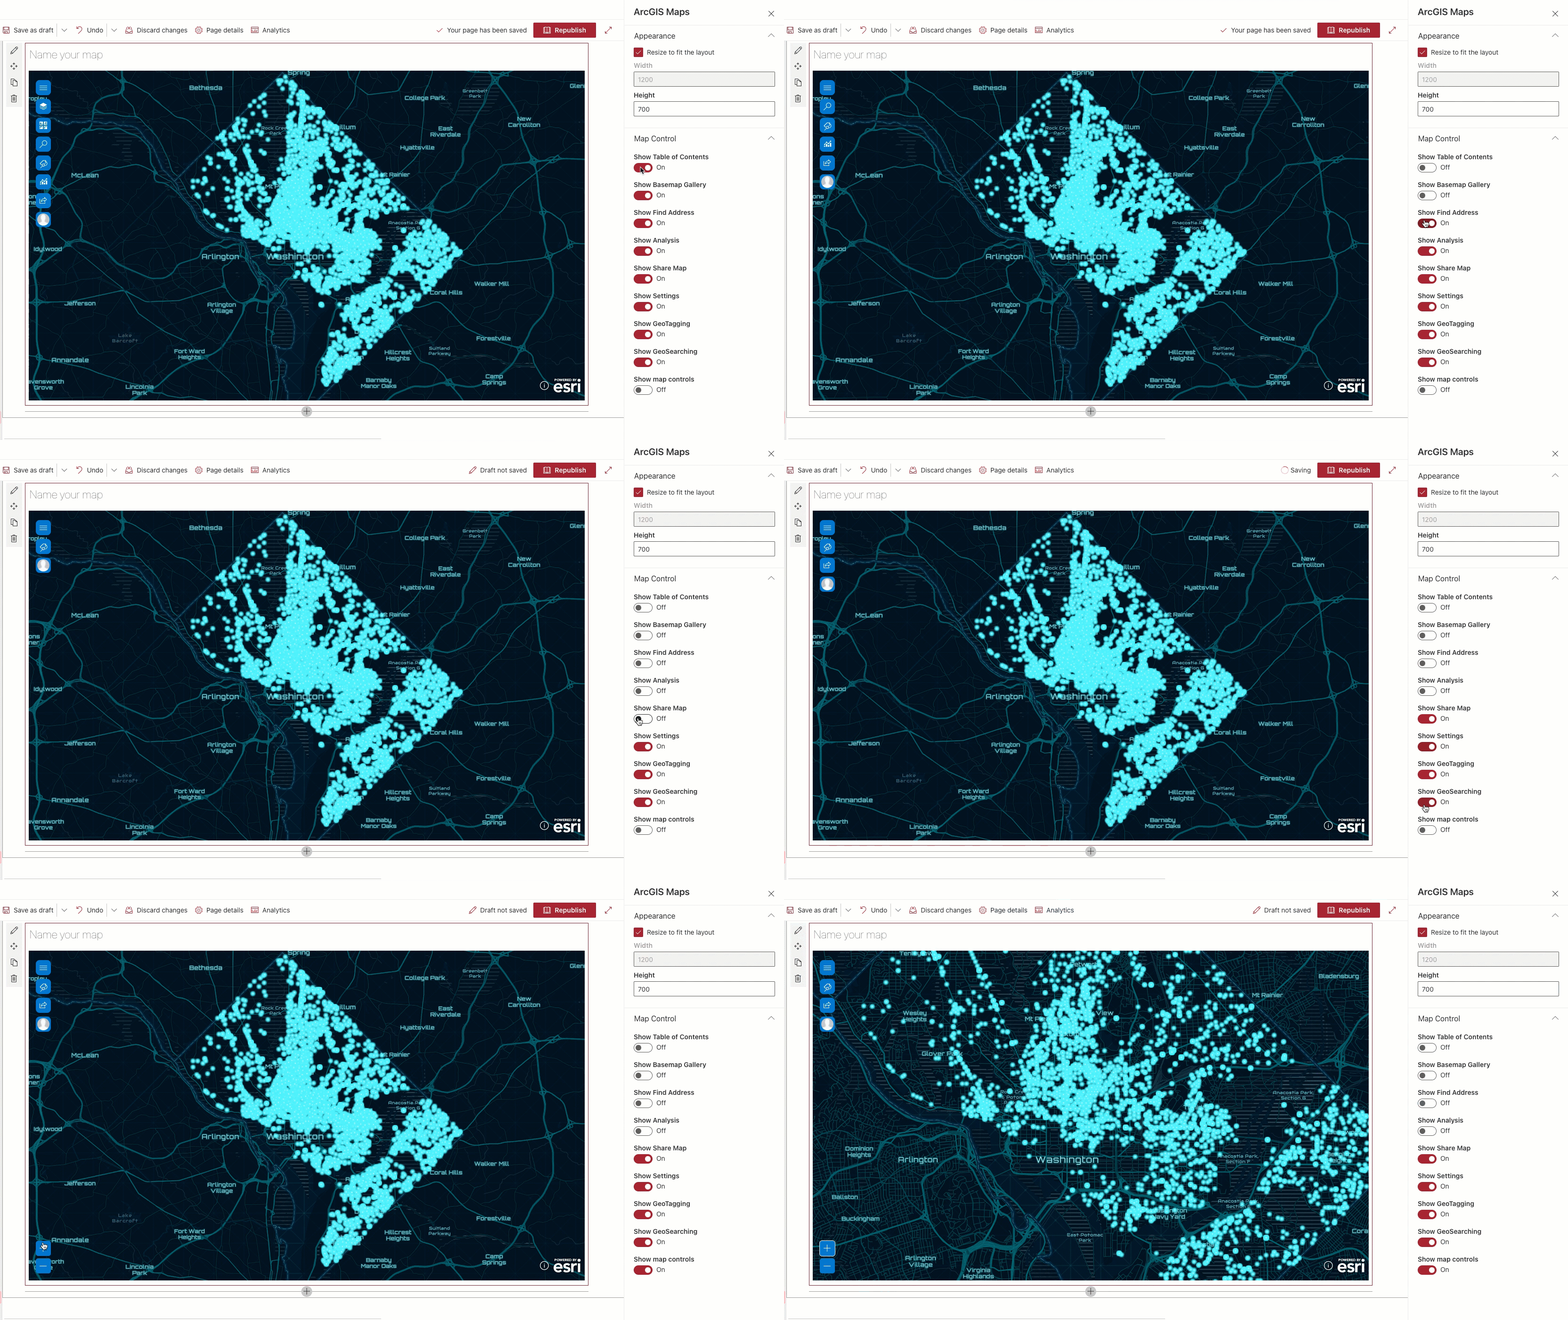
An added web part can be customized based on our needs. We can edit, move, duplicate, and delete the web part we added. In Edit web part, we can adjust width and height of the map, configure map controls, and zoom in and out of the map.
See the following for more information:
How was your experience with ArcGIS for SharePoint? Share your comments and feedback on the ArcGIS for SharePoint Esri Community page.

Article Discussion: