A new set of resources is now available that describe global shoreline characteristics. Ecological Coastal Units (ECUs) were developed by the U.S. Geological Survey (USGS) in partnership with Esri and the Marine Biodiversity Observation Network (MBON). These data were developed as part of a Group on Earth Observations (GEO) initiative called GEO Ecosystems (GEO ECO), and is associated with a GEO ECO task to develop global coastal ecosystems data.
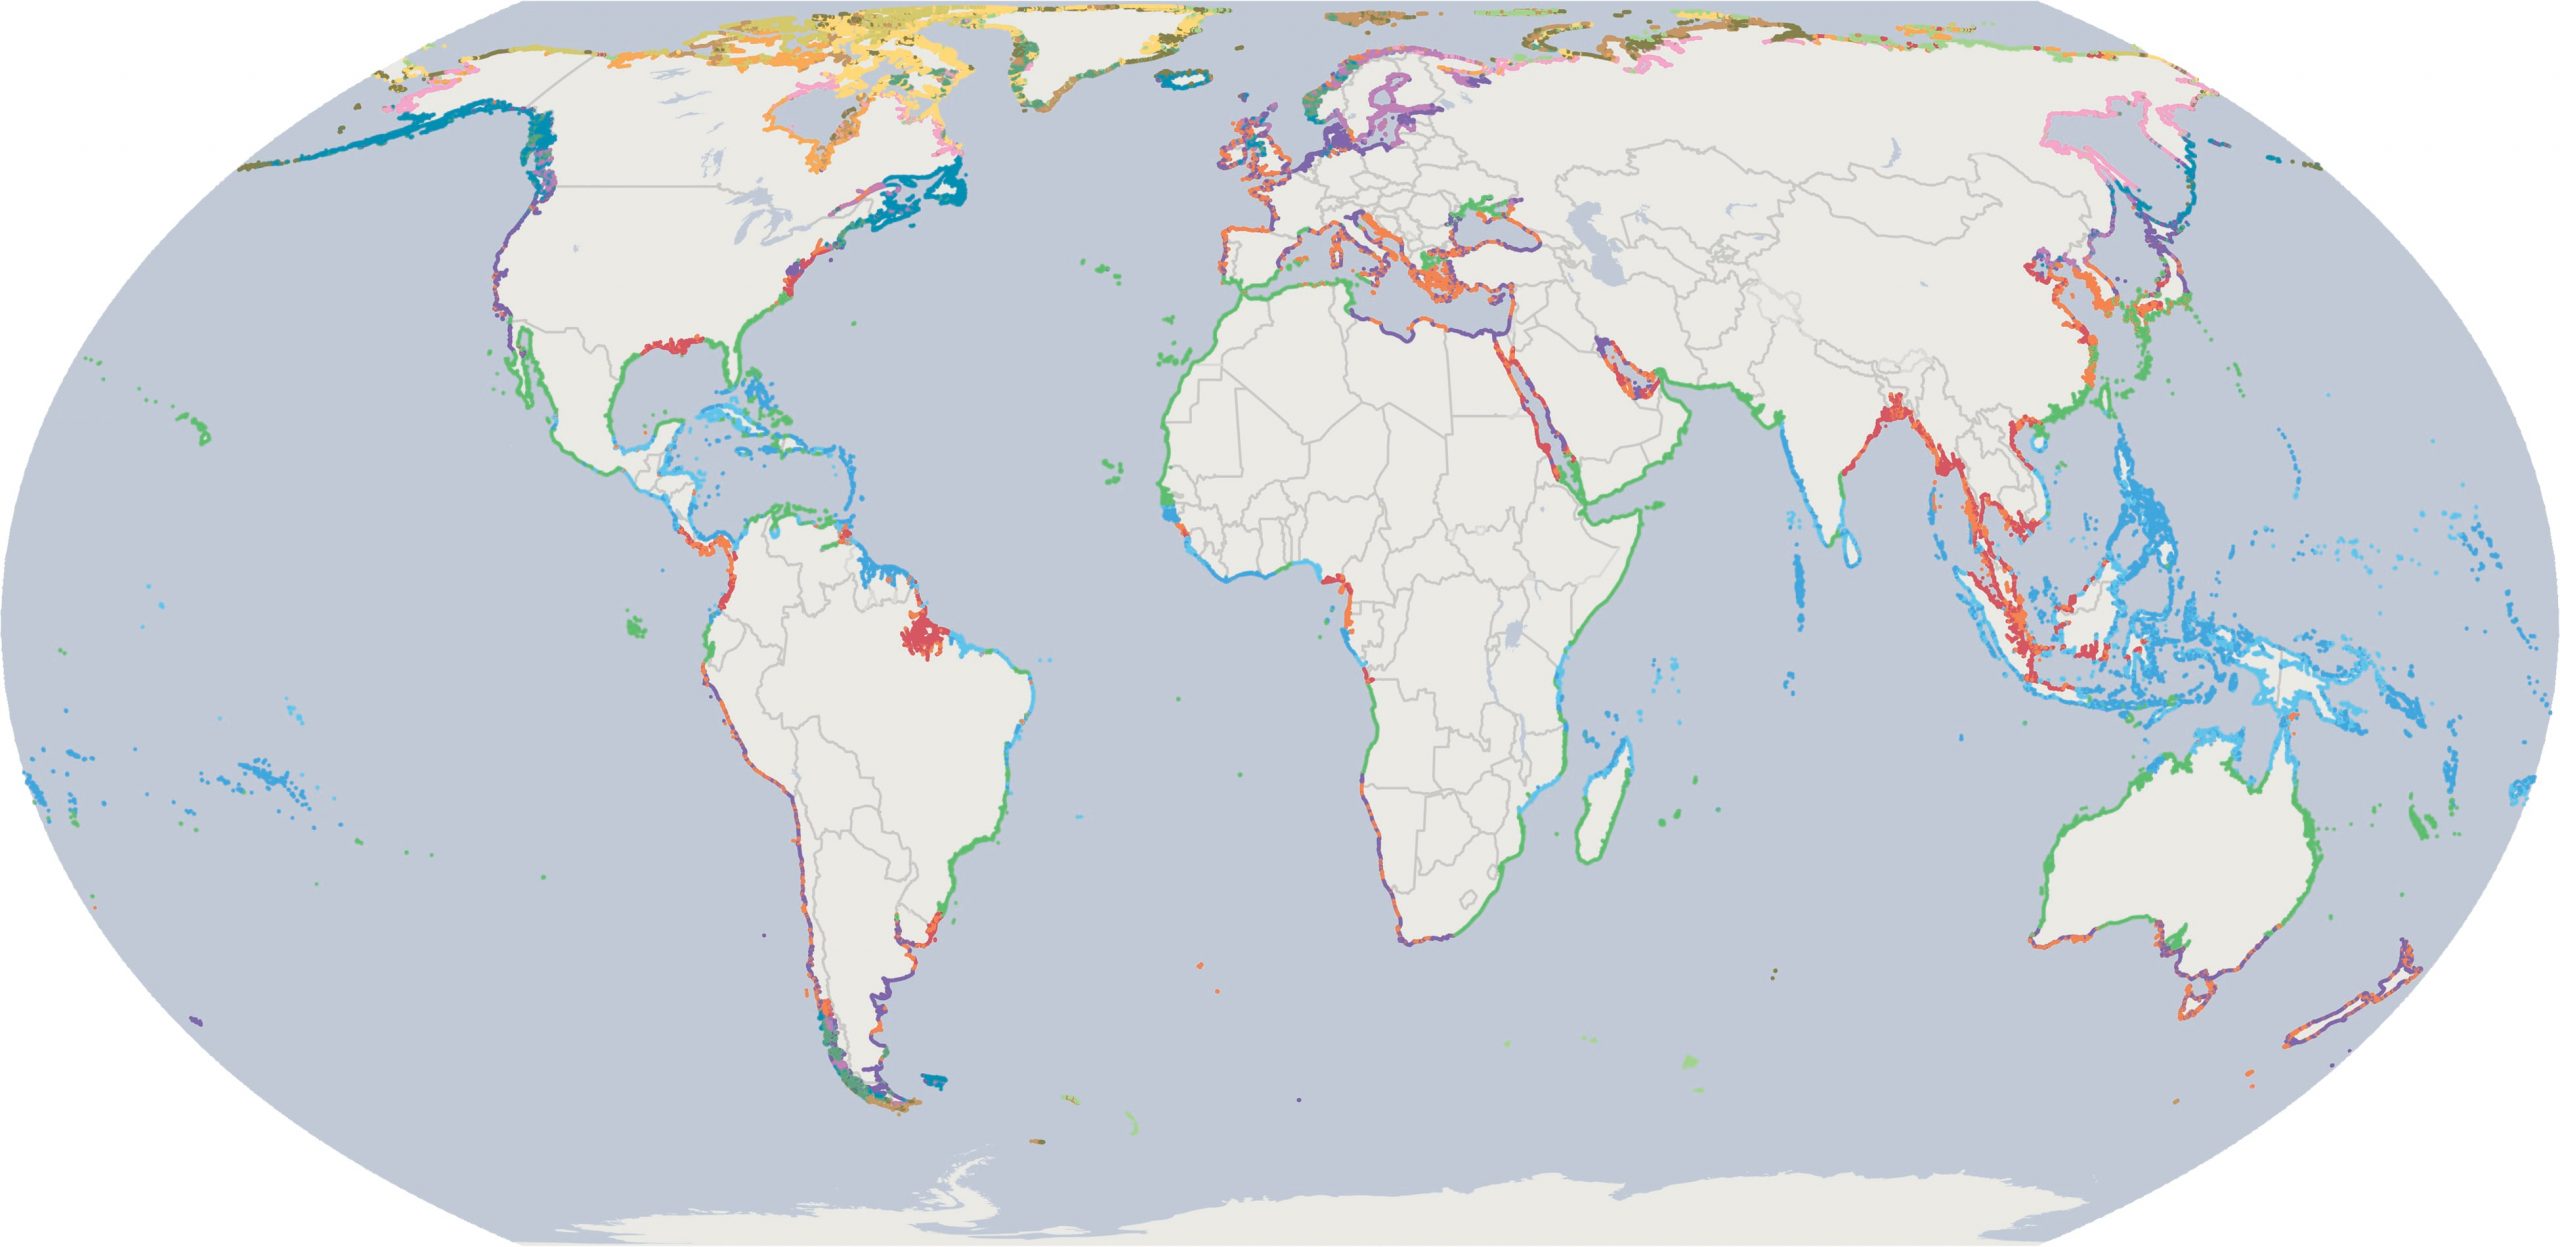
The data allows for the visualization and query of any stretch of coastline on Earth, except for Antarctica. The underlying data are 4 million 1km or shorter coastal segments, each of which is attributed with values from ten ecological settings variables representing the adjacent ocean, the adjacent land, and the coastline itself.
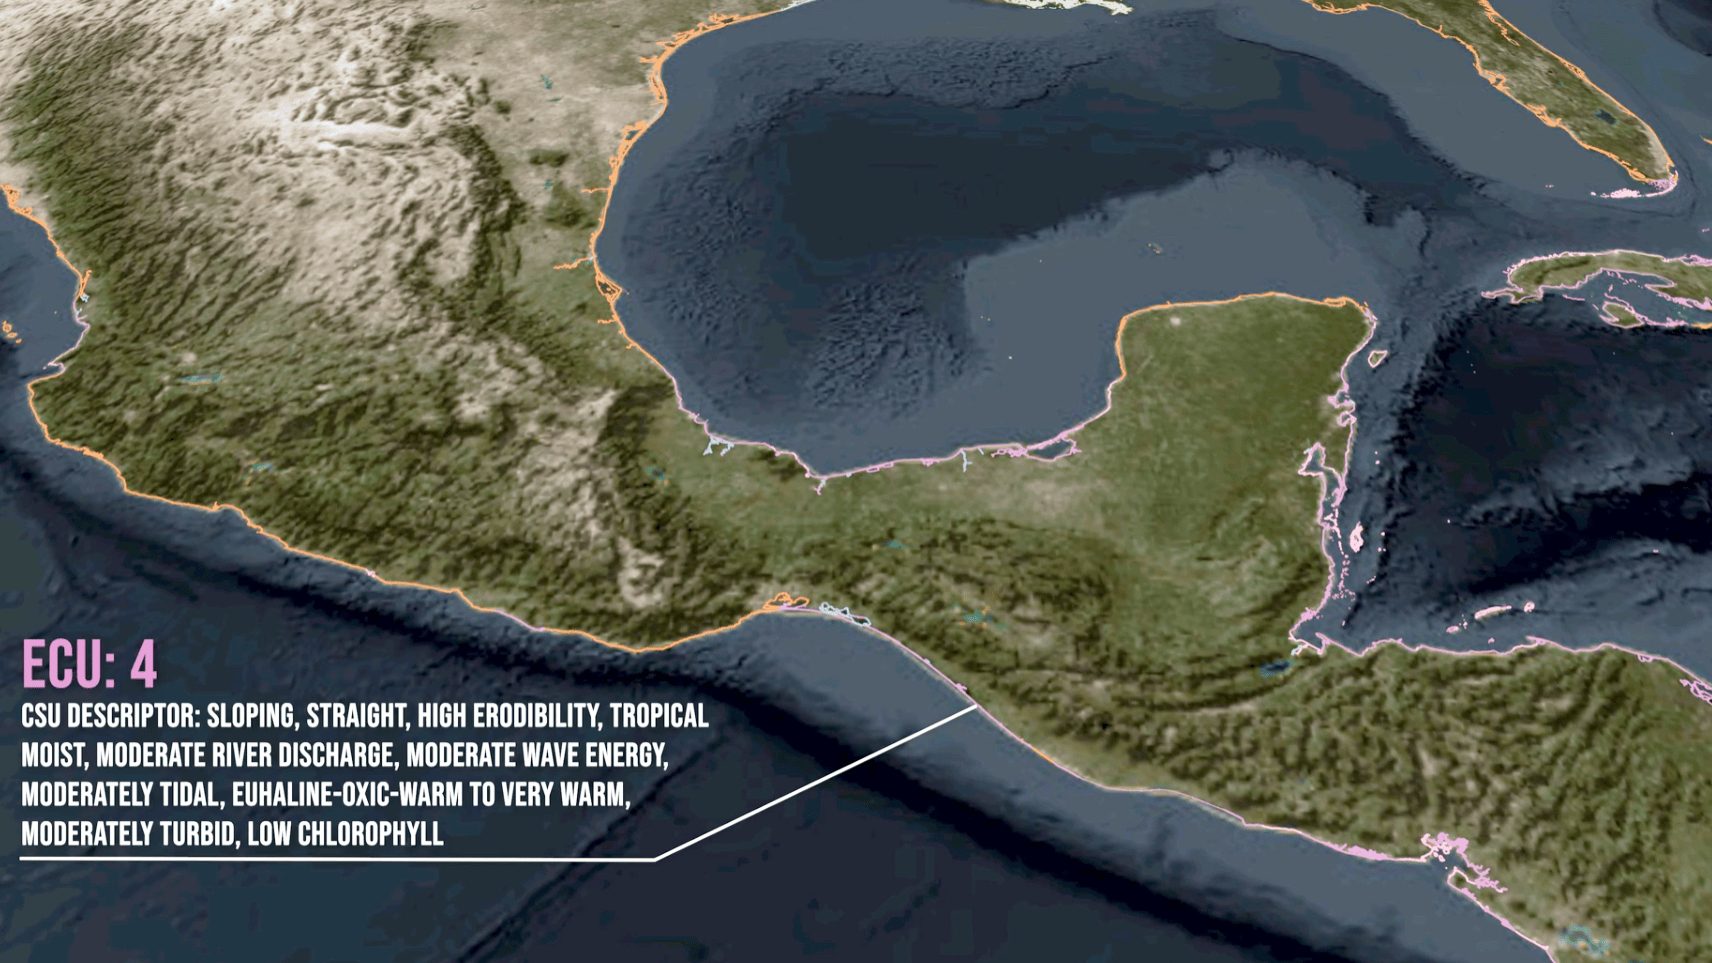
The 4 million coastal segments were classified into 81,000 coastal segment units (CSUs) using the Coastal and Marine Ecosystem Classification Standard (CMECS). Each distinct CSU is a segment with a unique combination of the classes of values of the ten ecological settings variables. The 4 million segments were also clustered into a set of 16 global groups of coastlines which are similar in the aggregate ecological setting described by the ten variables.
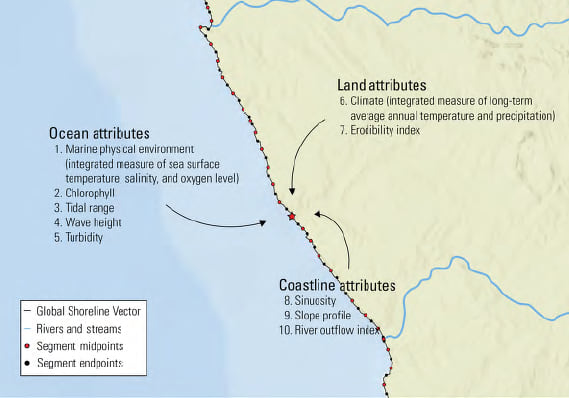
The set of 10 attributes describe the aggregated ecological setting in which the coastal segments occur. The values for these variables are drawn from a variety of data sources and attributed to the coastal segment midpoints.
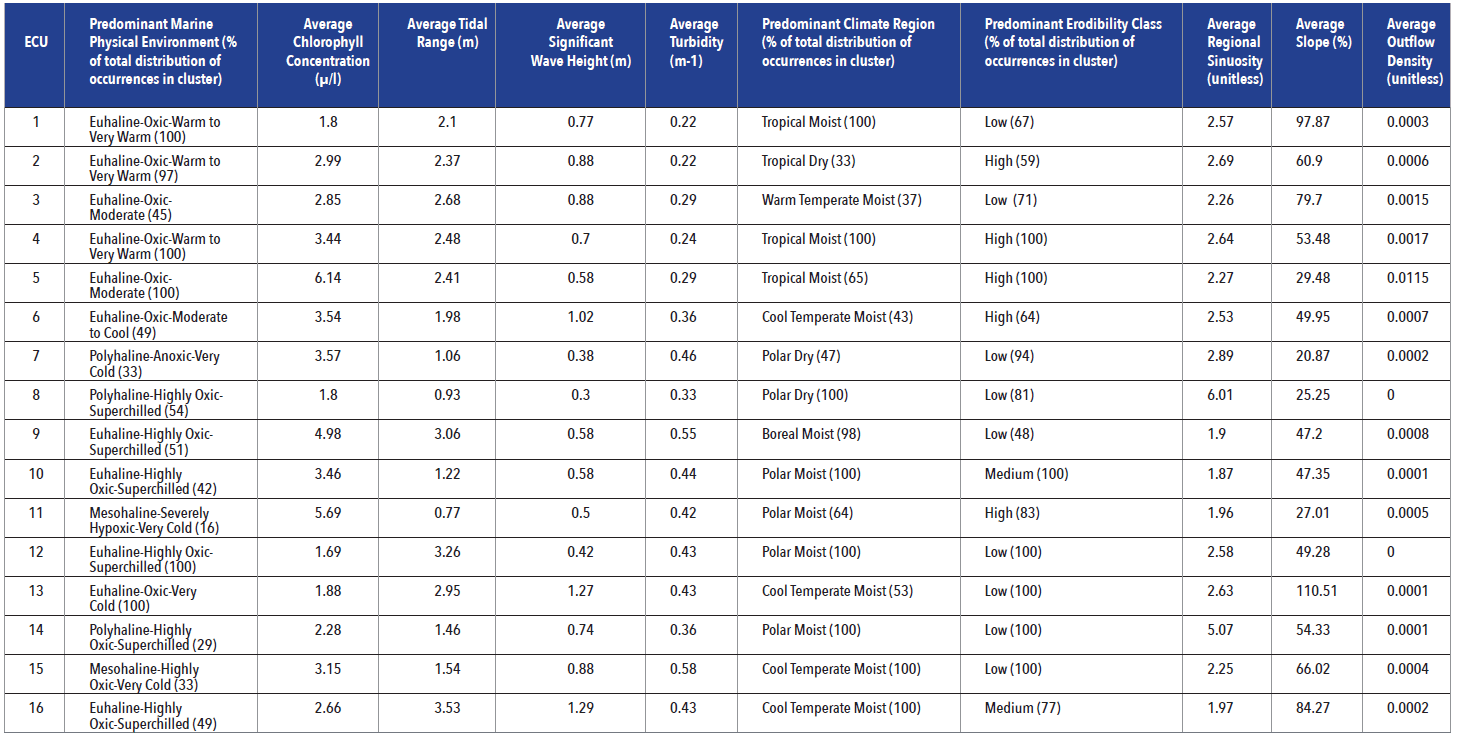
These 10 variables represent the ecological settings of coastal environments.
- two land variables,
- five ocean variables, and
- three coastline variables.
Each segment midpoint was attributed with values for each of the 10 variables. The variables describing the ocean environment included an integrated measure of physical properties (temperature, salinity, and dissolved oxygen), and chlorophyll concentration, tidal range, wave height, and turbidity. The variables describing the land environment were climate setting (as an integrated measure of long-term temperature and precipitation), and an index of erodibility. The variables describing the coastline were its regional sinuosity, the slope profile of a 200m perpendicular line segment extending 100m landward and 100m seaward from every segment midpoint, and an index of river outflow.
Following the attribution of the segments, they were classified by establishing class labels and associated ranges of class values for each of the 10 variables. Where possible, the class labels and class value ranges were consistent with the CMECS nomenclature and breakpoints. The classification step resulted in the development of CSU’s defined as any segment with a unique set of class labels for the 10 attributes.
These ECU data are made available in ArcGIS Living Atlas of the World as an online feature layer representing the 1km shoreline segments as well as an ArcGIS Pro Package that can be downloaded and used in desktop visualization and analysis.
- Ecological Coastal Units (ECUs) – feature Layer
- Ecological Coastal Units (ECUs) – ArcGIS Pro Package
Additional Resources:
Please contact Roger Sayre and/or Keith VanGraafeiland for more information.

Article Discussion: