By Natalie Feuerstein, Esri Cartographic Product Engineer
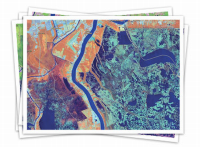
Landsat data are multi-band moderate resolution satellite images of the Earth’s surface that are often processed to enhance particular features through different band combinations. Scientists, academics, and remote sensing professionals have long used Landsat data to support global assessments of land cover, land cover change, and ecosystem dynamics, such as disturbance and vegetation health. Now, these data can be freely and easily accessed through ArcGIS Online and used in ArcMap for your projects.
The Landsat archives date back to 1972. That’s more than 30 years of continuous global imagery coverage! To help increase exposure to and use of the data in these archives, the U.S. Geological Survey (USGS) and the National Aeronautics and Space Administration (NASA) came together to create a composition of Landsat data called the Global Land Survey (GLS). The GLS data present the best-of-the-best images spanning almost four decades: GLS 2005, GLS 2000, GLS 1990, and GLS 1975.
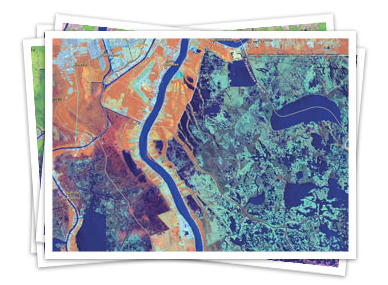
These data are not just “pretty pictures”. The Landsat image services on ArcGIS Online provide dynamic access to all the spectral and temporal information in this massive collection of imagery. Landsat Image services do not rely on caching; instead, the imagery is delivered using on-the-fly processing which enables you to view different band combinations, different epochs of imagery, and process multiple bands to derive new products.
Landsat data are composed of seven different bands, each representing a different portion of the electromagnetic spectrum. Individual bands can be combined in a Red, Green, Blue (RGB) composite to highlight different properties of features in the image. Let’s take a look at some commonly used Landsat band combinations:
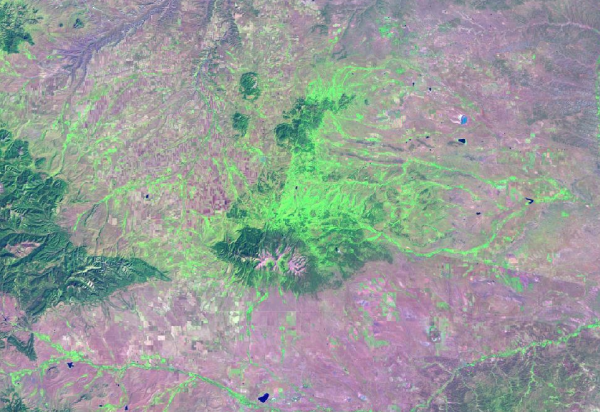
- If you want to easily see where vegetation is alive and where it’s dead, check out the Agriculture (541) service in which healthy vegetation appears bright green.
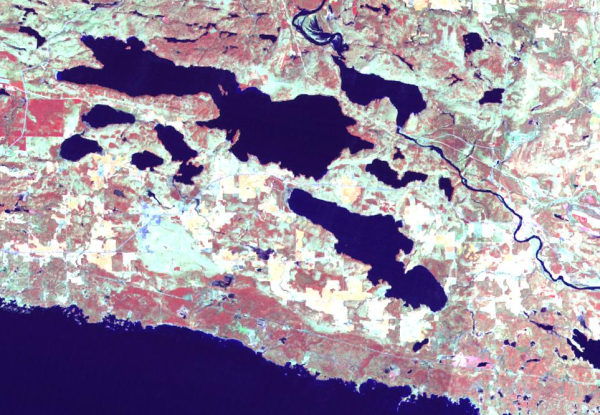
- If you need to differentiate between water and land, you might use the Land / Water Boundary (453) service in which water features appear very dark.
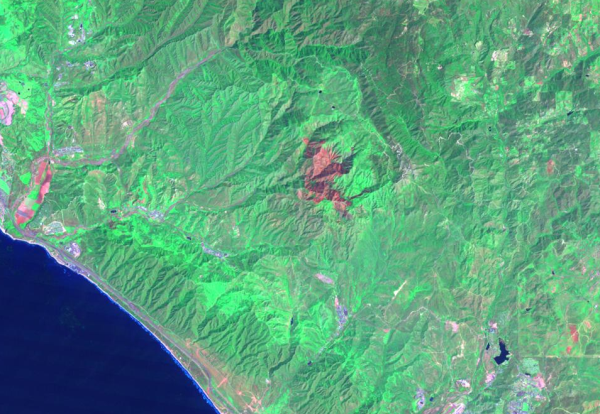
- If looking at the before and after effects of wildland fires is your thing, then the Natural with Atmospheric Penetration (742) service might be your first choice because fire scars will be bright red.
The multi-decade GLS Landsat datasets have been time-enabled. Using the time slider in a Web map, in ArcGIS Explorer Online, or in ArcMap you can easily see how things have changed in your area. For an example of this, check out the Glacier Retreat in Alaska presentation using ArcGIS Explorer Online!
In addition to the image services and ArcGIS Explorer presentation you can find a Web viewer that allows you to get a feel for Landsat data and explore the possibilities for their use and applications. With the ChangeMatters Viewer, you can quickly produce a change map highlighting vegetation increase and decrease by simply selecting the time periods and images you’d like to use!
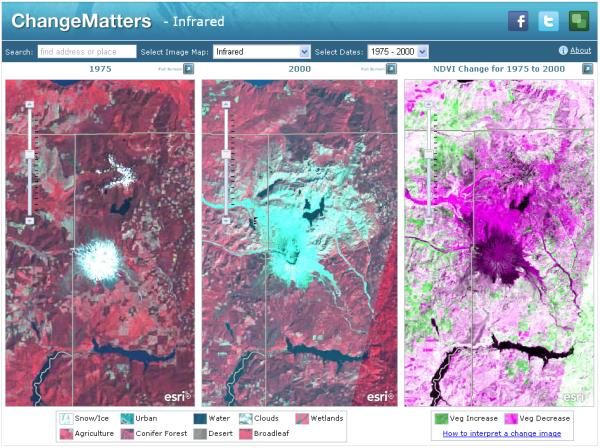
For more information, to explore Landsat services, and to get your hands on the ChangeMatters viewer, visit the Landsat landing page.
Thanks to Aileen Buckley, Mapping Center Lead, and Rajinder Nagi, Mapping Center Cartographic Product Engineer, for their help with this blog entry!

Article Discussion: