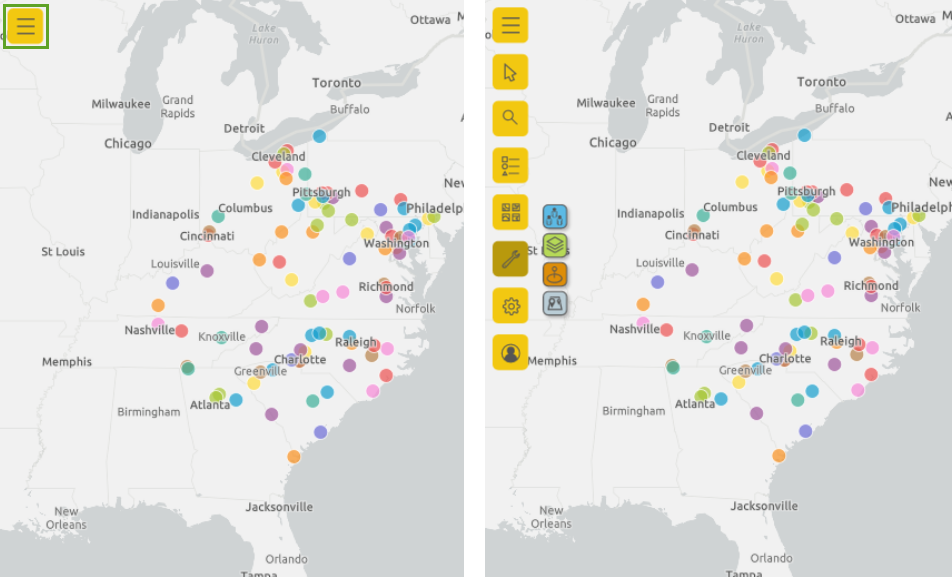
ArcGIS for Power BI introduces a new way to access the map tools you’ll need to create compelling maps in Power BI.
As a report designer, you can create and customize beautiful maps that let you tell your story without worrying about widgets hiding the map or report consumers changing the map’s default state. Consumers see the map exactly as you intended.
Expand the map tools
When you first create a map using ArcGIS for Power BI, the available map tools are all collapsed under the map tools button. Simply click to expand the toolset and you’re ready to get designing!
Report designers can also customize which tools are visible to consumers by clicking a few options in the Power BI format pane.

You’ll notice that some of the buttons also expand to offer more options. The Analysis tools let you add infographics cards or reference layers to the map, find locations within a certain distance from a selected point, or find locations with similar attributes. Similarly, different selection tools are available, depending on the type of layers in your map; if you’ve added a reference layer to your map, for example, the Reference Layer Select tool appears alongside the standard Single-Select and Box Select tools.
Use the other tools to search for an address and pin its location on the map, display the Layers list, or change the basemap.
Get more tools in the Format pane
In addition to the map toolset, a series of other tools in the visual’s Format pane allow you to customize map elements such as the Layers list, the map’s extent, the position of infographics cards on the map, and the pin color for search results. You can turn several of these map elements on or off to further refine how your users see the map in the final report.

Take a few minutes to explore the new user interface and discover all the ways you can make your maps and reports shine!


Article Discussion: