In education, there’s ever deepening understanding of the importance of different learning styles—visual, auditory, reading, writing, and kinesthetic (hands-on). In the business world, marketers and HR professionals are catering to distinctive styles of learning and thinking. The boardroom would do well to take note. By intentionally hiring employees with diverse thinking styles, a company can improve its strategy, planning, problem solving, and outcomes.
Best-selling author and industrial product designer Temple Grandin recently wrote in a Forbes blog that disasters might have been averted if visual thinkers had had a more prominent role at Boeing and the Fukushima Daiichi nuclear power plant.
Grandin says many mathematical minds aren’t good at seeing how a system could break. The reason, she believes, is that they lack visual thinking.
Valuing Visualization
People whose minds process information as visual representations tend to see the outcomes of certain design risks, Grandin notes, while those with more of a quantitative mindset tend to calculate risk rather than envision it.
During the design of the Fukushima nuclear power plant in Japan, Grandin says, visual thinkers might have stressed the value of placing electric cooling pumps well above the level of the sea wall and installing waterproof doors. For the Boeing 737 MAX, visual thinkers might have drawn more attention to the lack of redundant sensors as a possible single point of failure. The delicate nature of both designs becomes clear through visualizations that reveal vulnerabilities, according to Grandin.
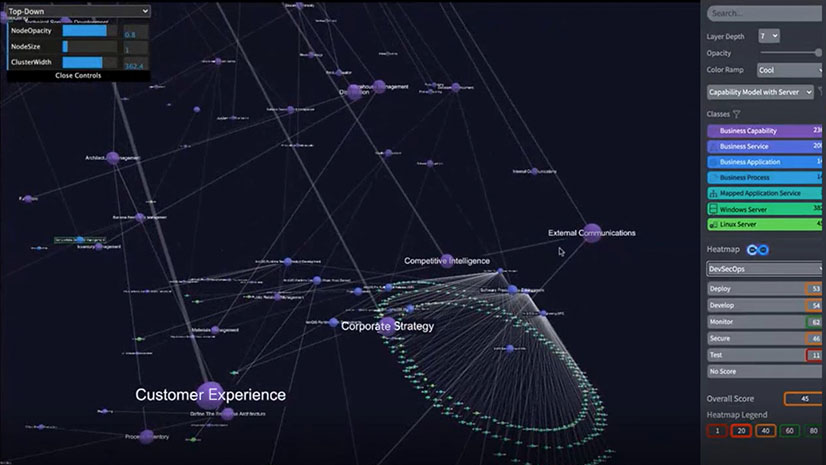
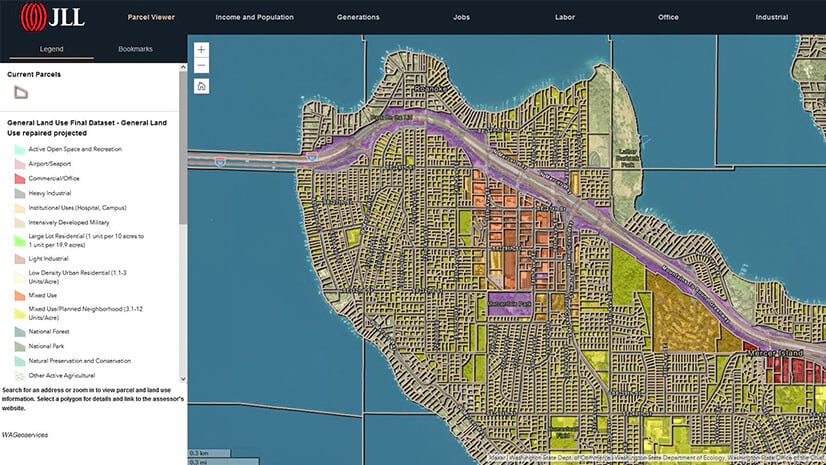
Modern technologies such as a geographic information system (GIS) help bridge the two kinds of thinking. GIS provides a common operational picture that each type of thinker can use to explore and analyze visual and analytical outputs. The result is a more holistic understanding of potential problems.
The visual thinker can spot conditions that stand out when data appears in a spatial context—via GIS maps and dashboards. The quantitative thinker can explore attribute tables and apply data science to create models that quantify risks and prioritize actions. Together, these thinkers can map the best path forward for a business or project.
Bringing Together Disciplines and Data Layers
Grandin has encountered both quantitative and visual thinkers on all the projects she’s been involved in during her career. The most successful efforts, she says, incorporated a mix of these talents.
Ian McHarg, one of the pioneers of the concept of spatial thinking—a form of visual thinking—devised transparent overlays for various kinds of information (infrastructure, land use, vegetation, wildlife, hydrology, soils, and more). Today’s mapping technology blends these and other views, allowing people to turn on and off layers to see relationships, gaining insights into challenges.
McHarg also pioneered using a mixture of disciplines in the design and planning process. In the 1960s and 1970s, he recruited geologists, ecologists, anthropologists, and ethnographers for his firm’s land-use planning work. This cross-disciplinary group viewed design and planning as keys to adaptability, and many of the places the group designed (such as Sea Ranch on the California coast) have stood the test of time. Bringing together diverse thinkers with cross-domain expertise certainly contributed to the lasting legacy of these projects.
Spanning Visual and Quantitative Thinking in Business
From its beginning, GIS technology has woven together inputs from different perspectives to inform better understanding and action. It has become a go-to resource for a variety of operational and analytical workflows.
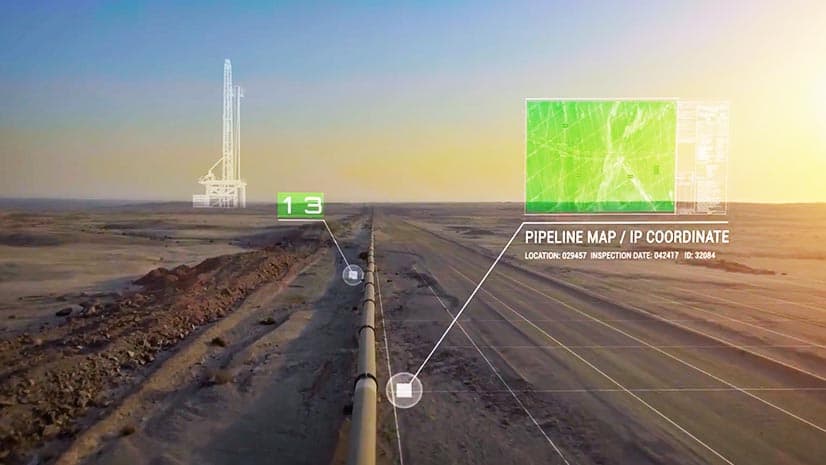
Electric and renewable-energy companies use GIS to design networks and monitor performance. The quantitative thinkers who explore the complexities of substation design, for instance, measure surrounding conditions and keep an eye on regulated outputs such as air pollution—tuning designs for minimal environmental impacts. The visual thinkers who plan distribution routes use map-based technology to create efficient paths that have a low visual impact and reach the most customers with the least amount of material.
Companies that manage retail outlets—banks, restaurants, grocery stores, and product destinations of every stripe—use location technology to identify and analyze markets and sites. Quantitative thinkers on their planning team might investigate data on customer demographics and competitors to create revenue forecasts for new stores. The visual thinkers might look closely at a shopping center’s design to mitigate the risk that it will hinder customer flow.
Meanwhile, organizations that manage delivery operations and complex supply chains use GIS to gain efficiencies in the flow of goods. The quantitative thinker often digs deeply into the data to tease out better routes or practices that can save millions of dollars on fuel costs. The visual thinkers can keep an eye on changing variables, such as weather, traffic patterns, or geopolitical risks, to quickly pivot and ensure that goods keep flowing.
Businesses thrive in an environment of complementary skills and thinking. With the growing trend to employ data scientists and AI specialists to solve business challenges, visual systems like GIS can help bridge the divide between quantitative and visual thinking. Acting on guidance from many types of professionals lowers a company’s risk while improving operational outcomes.
The Esri Brief
Trending insights from WhereNext and other leading publicationsTrending articles

December 5, 2024 |

July 25, 2023 |

November 12, 2018 |

April 1, 2025 |

April 29, 2025 |

February 1, 2022 |


