Alarmed by the mounting consequences of the climate crisis, people have begun to take change into their own hands, reducing household carbon footprints by buying sustainably sourced clothes or switching to electric vehicles.
Less attention goes to the digital carbon footprints generated when we perform an internet search or visit a website. The data centers underlying the internet require huge amounts of electricity, which in most cases is still produced by fossil fuels. As remote work and resource-intensive cryptocurrency mining add to the load, digital activity could account for 14 percent of the world’s CO2 emissions by 2040, according to Boston Consulting Group
With help from geographic information system (GIS) technology, the award-winning web application DigitalFootprint.earth helps users visualize and quantify how even a seemingly innocuous visit to a news site can compound the challenge of climate change.
How Big Is My Digital Carbon Footprint?
Developers Samuel Larsen-Disney and Yannis Panagis created DigitalFootprint.earth as part of a sustainability-minded hackathon; their project took first place.
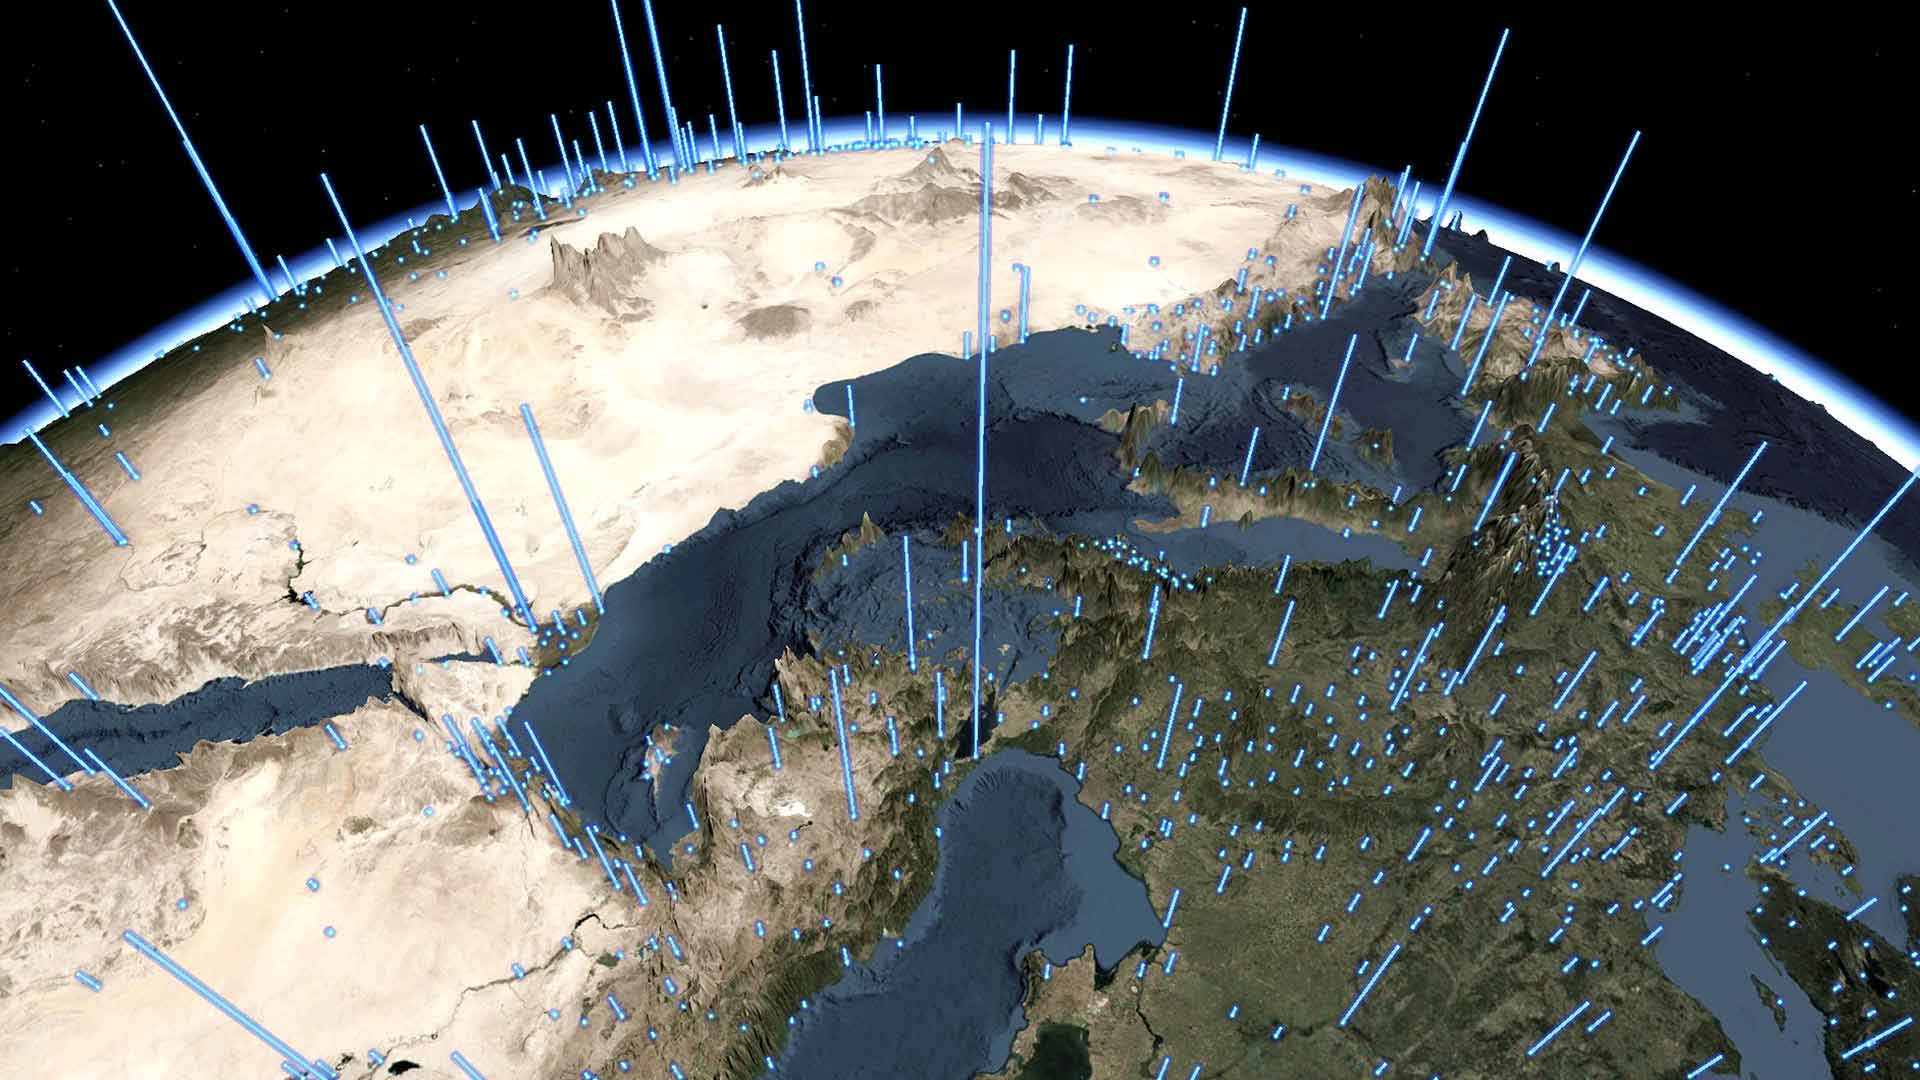
Centered on a spinning 3D globe, the app combines data analysis and interactive storytelling to illuminate the environmental costs of global internet use. While each web user might contribute only a fraction of total CO2 emissions, the billions of internet users worldwide account for a level of greenhouse gases that rivals that of the airline industry’s.
The app harnesses location intelligence—insight created by GIS software—to highlight the spatial connection between internet searches and the distance each service request travels. The farther the digital content goes, the greater the amount of C02 emissions.
This short video shows how the analysis works:
DigitalFootprint.earth traces the path of a website request to the nearest internet service point (ISP) with a bright yellow line on a map. Next, the app follows the transaction to the content delivery network (CDN), which could be thousands of miles away, and shows the user how much CO2 is created by that data journey.
To visually convey the digital carbon footprint of website visits, the app shows how far you’d have to drive around your neighborhood to equal the amount of carbon emissions produced by visiting a site 100 times. A 3D heat map of internet-related CO2 emissions by country makes clear this isn’t a geographically isolated phenomenon, but a global challenge.
A Greener Internet
DigitalFootprint.earth is designed to raise awareness of society’s digital carbon footprint, but it can also help individuals, companies, and website hosts change their practices to reduce CO2 emissions and produce a greener internet.
Drawing on Green Web Foundation analysis, DigitalFootprint.earth evaluates whether a hosting provider relies on clean energy. The app also gauges page weight to assign a digital carbon footprint score to each website. Site owners can reduce impacts by lowering page weights, while users can shrink their digital carbon footprints by deleting old emails, unsubscribing from unread mailing lists, and using devices like phones and laptops longer before replacing them.
It’s difficult to grasp how the actions of an individual or single organization can contribute to a problem as complex as the climate crisis. Through a highly visual, geographic approach, DigitalFootprint.earth unveils one of the hidden costs of today’s digital age, and indicates the small actions that can be taken to secure a more eco-friendly internet.
The Esri Brief
Trending insights from WhereNext and other leading publicationsTrending articles

December 5, 2024 |
July 25, 2023 |
November 12, 2018 |

April 29, 2025 |

February 1, 2022 |

May 6, 2025 |


