From biodiversity scoring to supply chain tracing to consulting, companies are using location intelligence for nature-based practices that set themselves apart from competitors.
Their motivations are varied but interconnected:
- Aligning with corporate values and delivering on customer expectations
- Minimizing contributions to climate change and nature loss
- Preparing for anticipated regulations
- Helping customers achieve sustainability goals
What binds them is the use of geospatial technology. With GIS, companies track materials, costs, and outcomes through a supply chain. They manage dashboards with biodiversity scores for every company property. They advise customers on best practices for nature-based assets.
These applications of location intelligence are quickly spreading across the globe, and this short video spotlights the role GIS plays in them. Drawn from WhereNext’s webcast, The Nature of Business, this mini-salon is a primer on how GIS, commerce, and nature intersect.
Chris Chiappinelli, WhereNext: Let’s get to the location aspects of what you do. All of you are focused on sustainability work in some form and are using GIS technology. I’m curious about how you use that software to understand the nature of your business.
Carlos, I know your team focuses a lot on the people and the communities, like you talked about. Maybe we can focus on the raw materials themselves, the bioactives, and the parts that go into your products. How does GIS work with those? How do you track material across time and space?
Carlos Talini, Natura: I think I have to explain a little bit [about] the chain—how the chain works. We work with family farmers, indigenous people. These farmers sell the products to the cooperatives, cooperatives that are made from family farmers from the region. And these cooperatives sell the inputs to us.
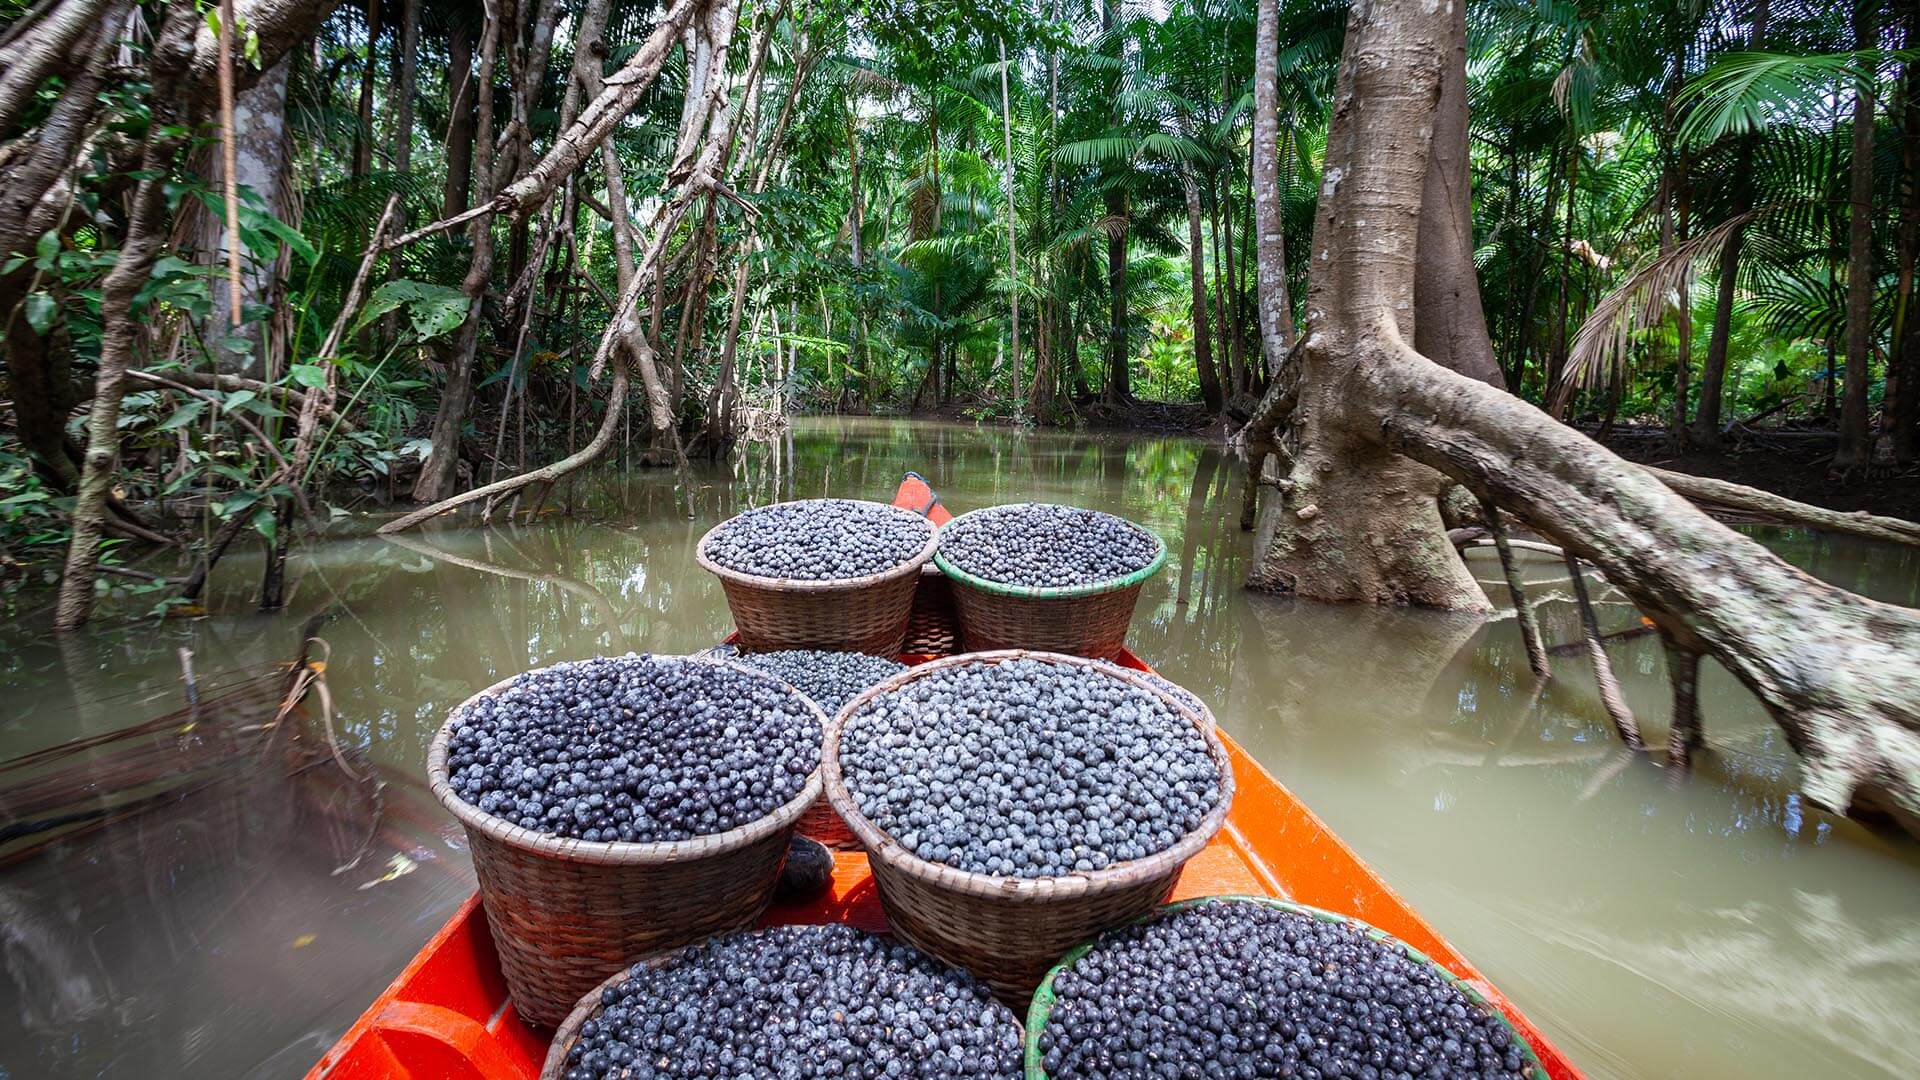
So, we track from the family, to the cooperative, to Natura, all the inputs that we source from the Amazon region, and all the data involved. So, the price paid, the amount, the kind of raw material—Brazilian nuts, acai, and other ones. We have all this data, and I know I can track each amount from each producer thanks to GIS, to ArcGIS that we have here.
Chiappinelli: So, it’s a robust supply chain, but each step along the way you’ve got eyes essentially on the process and the ingredients. Robert, how about you? Could you tell us a little bit about how you use GIS?
Robert Nothnagel, Holcim: We started off with land management because, as I mentioned before, we’re managing only in Switzerland, 2,000 plots of land. Some of them are linked to our asset database in SAP, in our ERP system. We have lease agreements on them. We have contracts which are expiring on them, and so we use ArcGIS to manage these plots of land and visualize them as well. And then we can see if there are some holes or some issues somewhere.
That’s helped us a lot because before we had the least simple Excel spreadsheet and that wasn’t cutting it. So, that was actually the start with the GIS. And then we went into this biodiversity [work], rolling out biodiversity projects, and our group came up with an idea to actually implement a system called BIRS [Biodiversity Indicator and Reporting System]. This is a way to measure biodiversity based on the different habitats we find in our quarries and sites.
And then we have to capture the different habitats, the size of the habitats, and there’s a multiplication and some special algorithms are behind there. And we rely heavily on ArcGIS to actually trace these habitats, then ground-proof them out there, draw maps, and calculate the areas concerned.
This method is, by the way, produced by IUCN, the International Union for Conservation of Nature. It’s very well reputed. It’s not an NGO; it’s really an environmental organization. And if you want to measure . . . the biodiversity on your land, you can go to IUCN.org and google “BIRS” and then you’ll find methodology. Quite interesting.
Chiappinelli: So, it’s about establishing what exists there in terms of biodiversity and then tracking and understanding it at different levels.
Nothnagel: The issue is always that our biologist goes out, he maybe has everything in his head, but then we have managers who are used to managing finance figures, and they want to see improvements, they want to see a trend. And so we needed a kind of KPI, a simple KPI, which can be derived quite easily without any special knowledge. And this helps with our management to understand what’s happening on the ground.
Chiappinelli: Perfect. I’m sure a lot of folks in the audience are at that stage where you’re trying to set a baseline and understand biodiversity in some ways. Ben, how about you? How is GIS being used at Land O’Lakes for nature-based practices?
Benoit Mourot, Land O’Lakes: At least I will answer for WinField United. So, everything starts from our test trials on our side. We have about 200 locations in the US that we call Answer Plot. And we use GIS to actually test all those hybrids across the US and in those different plots. And the idea for us is to collect information to know how the hybrids are performing based on different conditions, of type, and climate, and all that kind of thing.
That gives us a lot of information, data, and insight about those products across all the manufacturers.
So we do those test trials every year and try to get the insight about the different hybrids. And we basically measure different scores and things like that. And based on that, we go and engage with . . . the retailers, [who] are engaging then with the growers to do product selection and placement for the beginning of the season. Then we try to go and identify for their field which hybrid will be the most performant. And not just for one year, but over time as well. So, it’s with the aspect of sustainable yield in mind, so we don’t destroy their land. The idea is we put the best product there and then they can have a sustainable yield year over year. So, that’s one aspect of how we use that.
And we go sometimes even deeper when it comes to GIS because our recommendation then can also go into management zones, which is basically sub-zones within the field to tell you how to plant and how to push your fields. And we do that based on identifying how a field is performing.
How do we do that? It’s by looking at remote sensing imagery, and those are sometimes indicators of areas that are high performers or low performers. And that’s where we advise people to push a planting or slow down based on that, so financially also they end up in a good spot. So, that’s one aspect of how we use GIS in WinField United.
The Esri Brief
Trending insights from WhereNext and other leading publicationsTrending articles
December 5, 2024 |
July 25, 2023 |
November 12, 2018 |
February 1, 2022 |
July 29, 2025 |
June 10, 2025 |
