As consumers change everything from how they spend money to where they deposit it, an old law of banking—build a branch and they will come—is breaking down. In a sign of the shifting times, over 40 percent of core retail banking sales in 2021 were digital in nature, according to a McKinsey survey. To cope, financial institutions (FIs) are deploying advanced ATMs, self-service banking kiosks, and online services.
Many FIs are turning to consultants to analyze banking preferences in specific markets and determine the best mix of touchpoints for clients’ needs. Longtime ATM manufacturer Diebold Nixdorf has parlayed years of experience with FIs into an Advisory Services group that guides branch transformations.
Diebold Nixdorf advisers use geographic information system (GIS) technology to analyze local financial habits and shape the bank networks of tomorrow.
“We get really granular on our recommendations, and the deeper we get, the more we use the spatial component,” says Scott Weston, global adviser for banking channel transformation at Diebold Nixdorf.
By analyzing demographics, technology preferences, bank transactions, real estate data, retail indicators, and other metrics, Diebold Nixdorf consultants help FI leaders reimagine expansion or consolidation plans, sometimes in surprising ways.
“Location and what you’re trying to do strategically becomes very, very important to help drive revenue and do it efficiently,” says Simon Powley, head of Diebold Nixdorf’s Advisory Services team.

If you think about what we do, we can't do this without a GIS. It's just not possible.
A Location-Based Approach to Banking Optimization
Building a new bank branch can be a multimillion-dollar proposition. Location analytics might reveal that a strategically deployed mix of ATMs could accomplish the same goal for a much smaller price tag. If a new branch location is the most effective move, Diebold Nixdorf’s Advisory Services staff can steer banking executives to neighborhoods that will be the best fit based on population, age, spending, and other factors.
“They picked towns within counties that would be in line with what our long-term strategic plan is,” says Jackie Hoonjan, president and CEO of Pacific Cascade Credit Union, a client of Diebold Nixdorf’s based in Eugene, Oregon.
Using location analysis, the consultants recommended nine towns where new branches or ATMs could help Pacific Cascade reach members. Seeing the data on maps helped win over the company’s board of directors.
“We were kind of wowed with the numbers that they gave us, with the details that they gave us,” Hoonjan says.
The Diebold Nixdorf team recently worked with a financial institution in Jacksonville, Florida, that was planning branches to fill gaps in market coverage. Weston’s GIS analysis indicated that adding 15 to 20 off-premises ATMs could cover 85 percent of area households, while bolstering the FI’s visibility in the area.
“By leveraging this kind of mapping technology, we can help [FIs] decide the best place to run a pilot or where you are going to be more successful,” Powley says. “We’re not a one-size-fits-all shop. And that’s where our analysis and data capabilities really come into place.”

For the C-suite, I would say a map or a visual piece is 10 times more important than a PowerPoint slide with words on it, because they want to see and feel and touch it, and it becomes real life to them.
Right Number, Right Location, Right Technology
When Weston, fellow consultant Marilyn Howe, and their Advisory Services colleagues analyze data to optimize a branch and ATM network, they’re looking at the interplay of three factors: the right number of touchpoints, the right locations, and the technological proficiency of users in the area.
“We are looking to understand how customers are leveraging various channels and what that tells us about their preferred engagement with their financial institution,” says Howe, a senior manager in Advisory Services. “We’re always looking at consumer behaviors through the technology-usage lens, which is different from the traditional consulting perspective.”
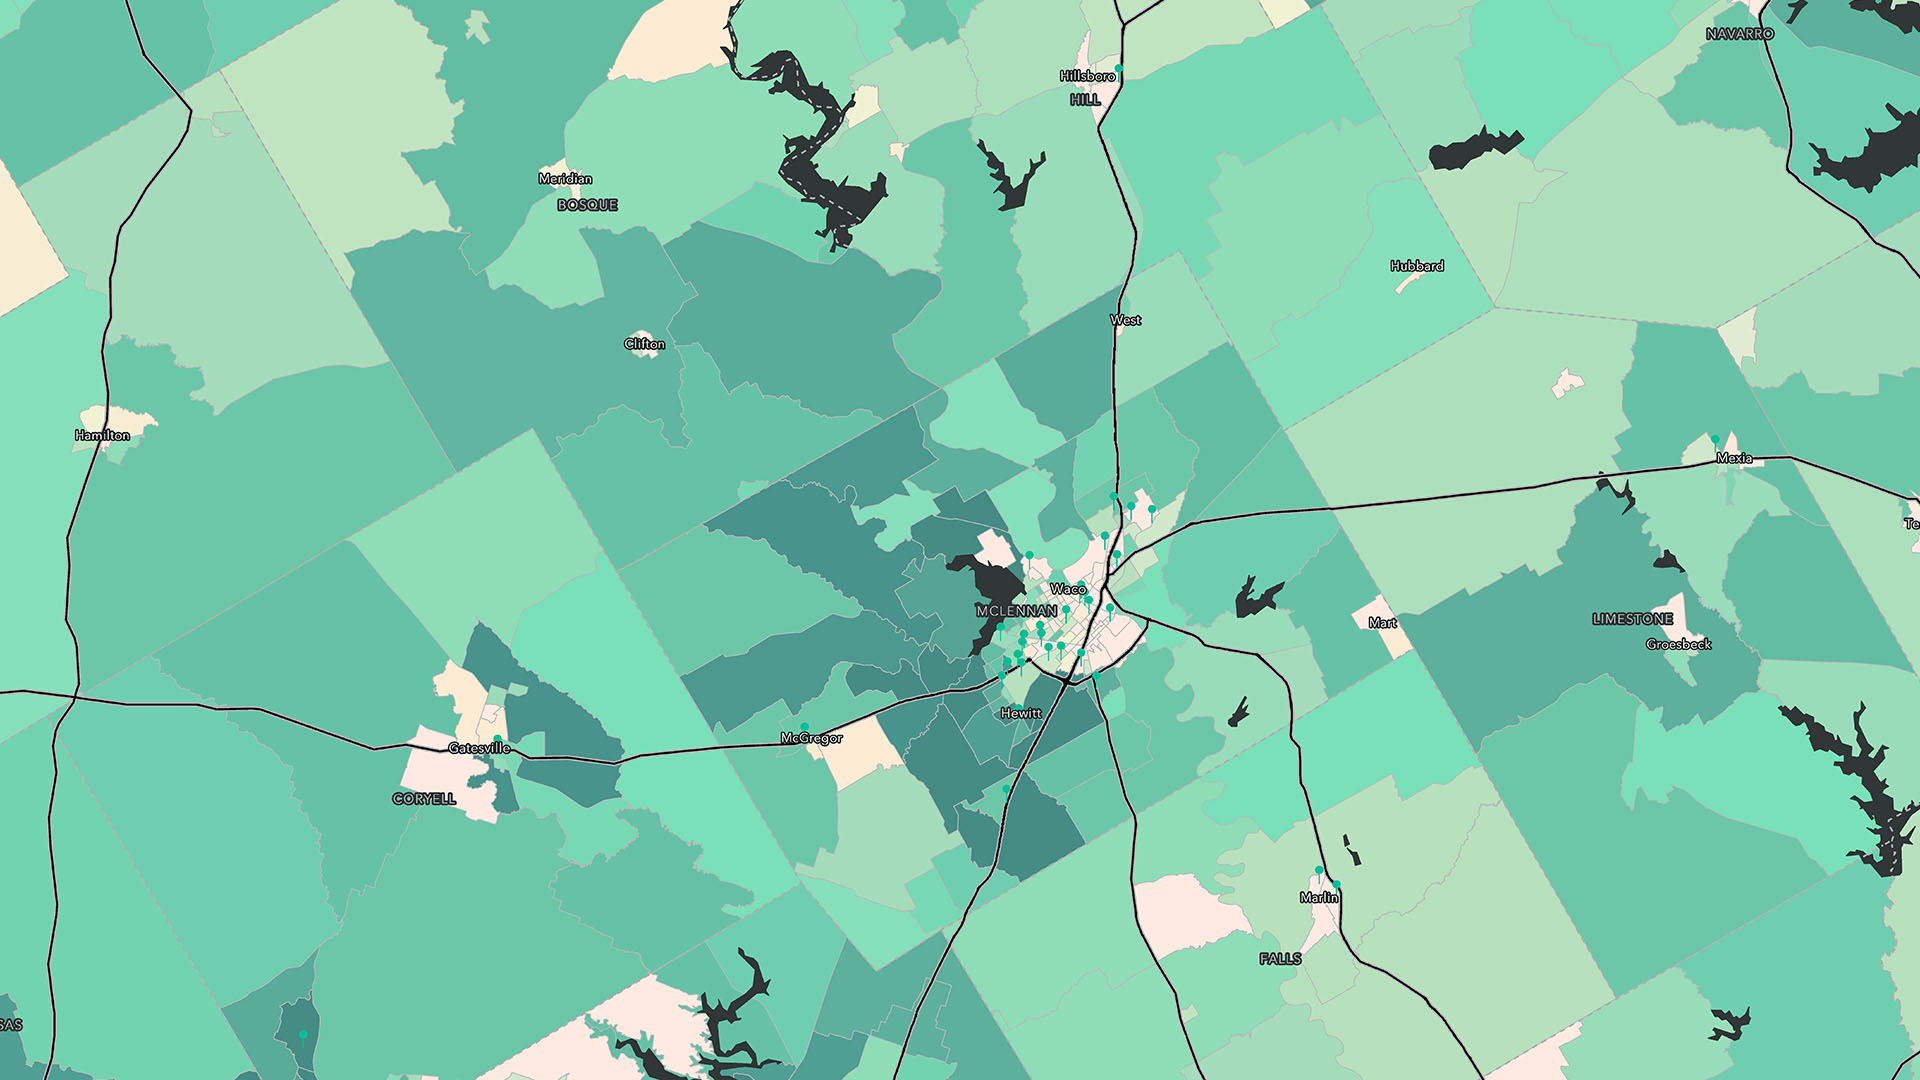
To determine the best locations, Howe and other Diebold Nixdorf consultants use GIS to analyze banking and shopping activity across neighborhoods. A hot spot analysis might highlight areas with high or low deposits. Metrics like borrowing capacity and spending enhance the view.
Finally, Diebold Nixdorf advisers add data that reveals local consumer comfort with online banking or ATMs. “We’ll use consumer insight surveys blended with demographic data to understand pockets of opportunity within the market,” Howe explains.
In the case of Pacific Cascade Credit Union, Diebold Nixdorf’s analysis helped Hoonjan push past generalizations. In Roseburg, Oregon, where the CEO is finalizing on one of the suggested properties, Howe found that 40 percent of members were younger individuals and families, suggesting a familiarity with technology. But Hoonjan has also found that young people still enjoy the human touch of a physical bank. Location analysis can help leaders fine-tune decisions that strike the right balance.
“The research part of it was showing [that] with all the statistics and the demographics of that area . . . we would pick up the membership that falls in line with what Pacific Cascade is all about,” Hoonjan says.

In the organizations we work with, I'm seeing that C-level leaders really find value in the complex data analysis we provide. Many of them have never had a GIS specialist on their team providing the spatial perspective.
A Granular View of Banking Markets
Rather than relying on general market trends, Diebold Nixdorf advisers like Howe and Weston root their recommendations in a bank’s own data—and the results can sometimes come as a surprise.
One credit union in San Jose wanted to identify which members might be at risk for attrition as the firm looked to consolidate branches. The organization’s leaders, who expected to lose hundreds or even thousands of clients, were shocked at Diebold Nixdorf’s GIS-backed projection that only 80 or 90 members might be at high risk of attrition at one location. In the end, the results confirmed the GIS analysis.
When trends like branch transformation disrupt industry norms, executives need guidance tailored to their unique markets, clientele, and strategic goals. Diebold Nixdorf’s approach, informed by location analytics, reflects the reality that not all customers are the same, nor do they all want to bank in the same way. Taking a geographic approach to data is one key to that granular view.
The Esri Brief
Trending insights from WhereNext and other leading publicationsTrending articles
December 5, 2024 |
July 25, 2023 |
April 1, 2025 |
November 12, 2018 |

February 1, 2022 |

April 16, 2024 |


