Climate change is here, and geospatial tools are already helping us adapt to the “new normal.”
It is hard to believe that as the Polar Vortex returns to North America bringing snow and subzero temperatures, meteorological offices in the UK, Australia, and other countries around the world announced that 2014 was the hottest year on record. Records dating back to 1659 tell us that eight of the UK’s top ten warmest years have occurred since 2002.
Soaring temperatures and high winds in Australia last year fueled some of the worst bushfires in more than 30 years. According to a recent report by Climate Council, a climate change research group based in Australia, changing weather, a growing population, and the proximity of vulnerable assets in bushfire-prone areas have increased the risks to lives and property. The cost of these bushfires is estimated to run into hundreds of millions of dollars each year. It is expected that Australia needs to double the number of firefighters by 2030 to cope with this threat.
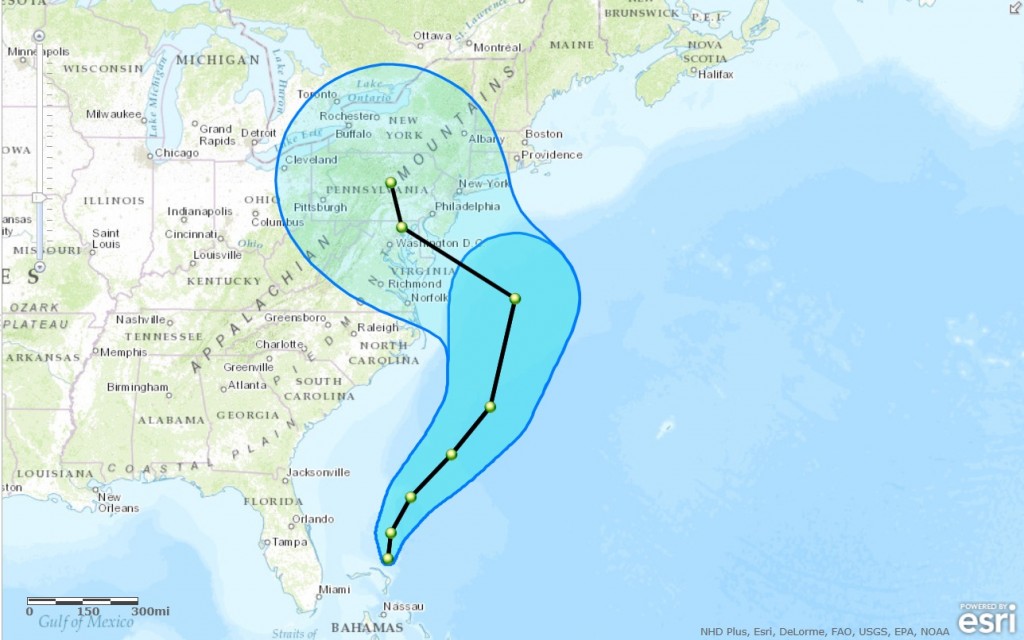
Ironically, record warm weather like Australia’s dry spells and drought in California are mirrored with increasingly severe wet weather, including cyclones, in the Pacific and Atlantic hurricanes.
This New Year, tropical storm Jangmi led to flooding and landslides in the Philippines, and more than 50 people lost their lives. Jangmi comes fast on the heels of Malaysia’s worst flooding in decades, which killed 21 people and destroyed 200,000 homes.
It seems that lately, weather is getting more extreme.
Even naysayers like Australia’s Prime Minister Tony Abbott, who once described the science behind human-induced climate change as “absolute crap,” are altering their opinions.
The New Normal
As climate change brings instability to short-term weather patterns, weather events are becoming more severe. This is challenging our understanding and ability to respond. Given this “new normal,” how can we best protect lives and better prepare for future events?

GIS and spatial analytics can help. GIS is the most powerful and intuitive tool for making reasonable, informed and congruent decisions that balance the needs of all individuals and actors from the wealthiest nations to the poorest that are most likely impacted as booming populations flock to coastal cities.
At its core, Esri’s ArcGIS platform helps people to discover, make, use, and share geographic knowledge with anyone, anywhere, on any device. It provides sophisticated, highly accurate and scientifically robust tools with which to precisely quantify and categorize risk, yet intuitive and easy-to-author templates to communicate and inform.
If we are to protect our lives and livelihoods, our infrastructure and financial assets, we need a tool like this to test, compare, and evaluate all available options. ArcGIS can help to:
- Better account for risks in financial system, in order to inform valuations and investment decisions and to incentivize organizations to reduce their exposure.
- Make information about extreme weather more usable and suitable for users’ needs and encourage collaborations and ongoing dialogue between producers and users of knowledge.
- Improve risk understanding and more accurately model impacts to provide relevant information for decision-makers, particularly at regional and local levels.
Leading the Charge
A number of organizations around the world are already using these tools to make better decisions in the face of our changing climate.
One of the best examples is The Nature Conservancy’s suite of online mapping decision support tools that are powered by the ArcGIS platform. Government agencies and other organizations can use tools like this to easily examine how to prepare for and respond to storm surge and flood damage. Since their introduction in 2008, the tools have been used for disasters both big, such as Hurricane Sandy, and smaller, such as coastal erosion in Washington State’s Puget Sound region.
Insurers are on the GIS bandwagon as well. Aon eSolutions uses GIS to help companies take steps to mitigate loss and develop contingency plans. Willis is doing something similar.
A newly announced online, interactive map from The United States Geological Survey (USGS) and Esri provides a platform for scientists, land managers, conservationists, developers, and the public to explore ways to improve resource management, planning and decision making. The world is divided up into 3.5 billion cells that describe different ecological areas.

And this scenario is being played out in thousands of locations all over the world. We have many tough decisions to make on fire, drought, heatwaves, landslides, and severe storm risk. ArcGIS is making this process easier with purpose-driven tools and templates that are readily customizable and easily adaptable to users’ needs.
ArcGIS helps us more easily share and coordinate information so we can make more prudent decisions on the risk and returns on investment of development. Together, we can leverage these tools to build better long term resilience to extreme weather and climate change.
