

January 28, 2025 | Brooks Patrick | Infrastructure
April 2, 2025
Like airports and seaports, major university campuses are semiautonomous zones that act like cities unto themselves. The work of managing a campus’s critical infrastructure, along with the people who live and work there, gets divided into departments, similar to a midsize municipality.
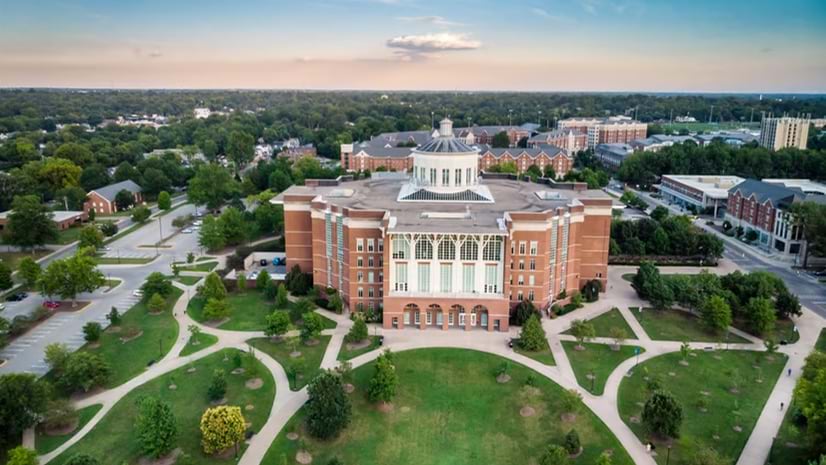
The complexity makes campuses ideal proving grounds for digital twins as operational tools. Nowhere is this truer than at the University of Kentucky, the Bluegrass State’s flagship higher education institution.
The university’s digital twin, built using geographic information system (GIS) technology, provides a centralized arena for managing operations. Administered by Eric Carroll, the school’s director of infrastructure operations, and created via Esri’s ArcGIS Enterprise platform, it models the facilities, utilities, and natural surroundings of the 918-acre main campus in Lexington.
Most digital twins are designed to model future developments, using current data to predict change over time. What Carroll and his team have built is an example of a class of dynamic digital twins that can also respond to change in the present, using real-time data from sensors, Internet of Things (IoT) devices, and other inputs. He calls it an integrated operations management system.
“The model at the core of all of this is a true digital twin,” Carroll said. “The buildings, the infrastructure, even our airspace, is replicated inside of this. That’s why it took years of study for us to create it.”

For over a decade, Carroll worked in emergency management, first as a firefighter in the US Marine Corps, a firefighter/paramedic in Highlands County, Florida, and then as the director of emergency services for the American Red Cross’s central Florida region. Though he loved the work, a downsizing and reorganization within the Red Cross forced a career change. Unfortunately, an injury sustained as a firefighter prevented him from being on the front lines of emergency operations again.
Looking for his next move, Carroll called upon a relationship he had built with the local school district’s assistant superintendent, and managed to talk his way into a job in information systems technology as a junior developer, although he’d never written a line of code in his life. He spent his first year working with the district’s student information system, crafting reports and building operations for classrooms, working alongside a few “20-something geniuses.”
“One of them was working with GIS, something that I’d never heard of before,” Carroll said. The co-worker had covered all four walls of his office with a object relationship map, a type of map that depicts how objects such as feature classes and their attributes are related in the database for purposes of comparison.
Carroll was hooked. “I sat there for the better part of six days studying it, reminding myself to go home at night,” he said. Within six weeks, Carroll had written his first GIS application.
GIS is often described as a way to make maps, but Carroll saw beyond mapmaking. He liked the visual aspect of maps, however what really captivated him was how they offered a way to store and project data.
“That’s the masterpiece behind GIS, because so much of what we do in this world relies on databases,” he said. “The graphical component on the front end is fantastic, but GIS is so much deeper and richer than cartographic representation.”
Around the same time, Carroll also learned about integrated workplace management systems—software that sits on top of other applications. “It’s what you use on a day-to-day basis to move information between different applications or departments,” he said. A building project, for example, could use such a system to move through the life cycle from planning to construction, operations, and maintenance.
“When I heard about that, I thought, ‘Well, OK, GIS does exactly that,’ because it’s database driven,” he said. The stage was set for Carroll to turn this capability into a digital twin.
In 2018, the University of Kentucky hired Carroll as a technical project specialist to map the campus’s utilities. The project involved an intensive audit of facilities and assets, often using paper plans for location clues. A unified geographic information system, accessible via mobile devices, helped Carroll’s team members track the information as they gathered it.
Carroll had his team focus on infrastructure. Soon, webs of cables, wires, and pipes began to populate the map.
But something was missing. The map was still just a map, a two-dimensional document.
The team had mapped the floors of multifloor buildings. Drones, lidar, and photogrammetry (a method of approximating 3D structures from 2D images) were helping to pinpoint the location of underground infrastructure—including depth—to within two centimeters.
All this information regarding things above and below the ground suggested the need for a third dimension. GIS had evolved enough to make this possible. With the help of GIS reality capture tools, the map became a 3D model, and then, when hooked to the database and sensors, it became a digital twin.
While 3D models are static, digital twins are dynamic. Using ArcGIS Velocity, an add-on capability for ArcGIS Online that can integrate large data streams into a GIS environment, the university empowered its digital twin to provide up-to-the-moment contextual information. Following the success of the digital twin research and mapping initiative, the university promoted Carroll as its infrastructure director.
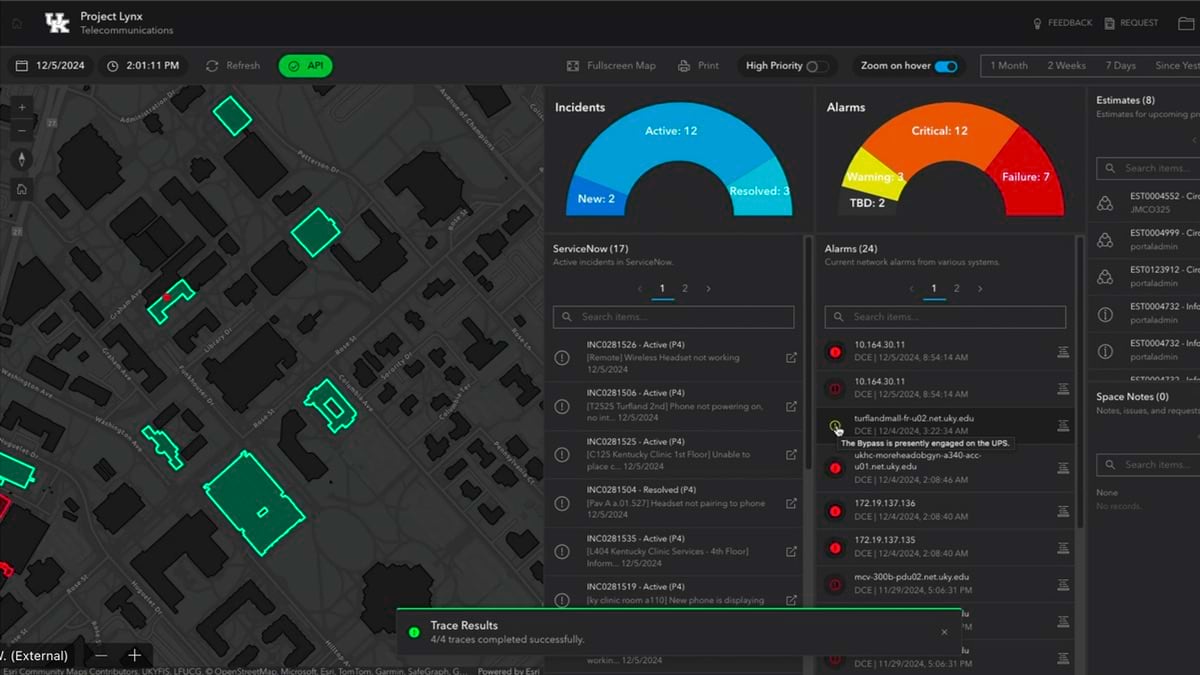
When something happens—or needs to happen—to the University of Kentucky’s infrastructure, the digital twin knows. Very soon, the people who need to know also know. Carroll recently demonstrated the basics of how this works.
He displayed a segment of the campus on his computer screen along with a dashboard that listed incidents and alarms. The dashboard signaled a battery problem with the sensor network that monitors the availability, health, and performance of the university’s uninterruptible power supply (UPS).
The building controls network, which interfaces with the digital twin, serves many purposes. It can detect room conditions, including temperature changes, barometric pressure fluctuations, and even water leaks in rooms with critical infrastructure. “Water and electrical components don’t mix well, so it’ll give us an urgent alarm for something like that,” Carroll said.
When maintenance issues arise, the UPS system automatically generates a work order and guides crews to where the work needs to be done. As the problem is addressed, the crews use mobile devices to close the work order.
What a digital twin provides is valuable context, something Carroll said is a crucial component of managing the university.
“What we can do now, and what we couldn’t do without GIS, is see relational issues,” Carroll said. “Let’s say, for instance, that we have two buildings right next to each other that lose power. We can tell how they’re related because GIS gives us the exact locations of the problems. If it’s an electrical issue, we will see all the related outages comprehensively and holistically.”
This complete picture greatly simplifies troubleshooting. “I’m able to solve the problem in a fraction of the time it would normally take,” Carroll said. “A lot of investigation can be done based on relational data we have from all these systems that are integrated into one.”
The building controls network even extends to the school’s sewer system. Sensors on utility holes can detect backups, noting if a sump pump has kicked in or whether human intervention is required. This is helpful information if maintenance crews need to go down there themselves. “We don’t want to put somebody down into a pool of water,” Carroll said.

Utility holes comprise a mere sliver of the twin’s depicted subterranean infrastructure.
“Here’s a contextualized view of the spaghetti we have under our feet,” Carroll said, showing his screen now covered with a dense mesh of intersecting colored lines.
This part of the digital twin showed the sum total of the University of Kentucky’s underground infrastructure: including gas and electric lines, the sewer system, and water pipes. It was like looking at the map of the London Underground rail system, after centuries of adding new lines and routes.
The speed with which Carroll’s team has built this representation into the twin is remarkable. “The entire system you’re looking at, I started in 2018 and built every one of those,” he said. The effort is ongoing. Every time a construction site breaks ground on campus, Carroll’s team flies drones over it to get a better sense of the subterranean critical infrastructure.
Carroll clicked another tab on the dashboard to show the labyrinthian fiber-optic network that delivers high-speed internet around the campus. Fiber-optic cables carry data via pulses of light that travel through thin glass fibers. Every cable contains several of these strands. Dots along the lines on the map represented circuits, the points where a strand in one cable hands off data to a strand in another.
“We use this every day,” Carroll said. “Part of our workflow is determining whether we have available strands to support the bandwidth, and the only way to do that is by looking at the GIS map.”
At a major research institution like the University of Kentucky, new broadband requests are ongoing. For each new connection, engineers arrange a unique path through the network, from circuit to circuit.
Carroll selected a path on the map. The path, broken down by segments, appeared as a flow chart on the dashboard. “You can see that cable FC-488 has six available strands, and we’ll need to make three circuit connections,” he said.
Like a commuter consulting a subway map to determine the route with the fewest transfers, the engineers plot a route with minimal transitions. “We want the fewest hops, because anytime you splice cables together, there’s some light loss, which affects the bandwidth,” Carroll said.
The digital twin also helps provide proof that a proposed path is possible. “I’m going to initiate a trace, which will happen live as I do it,” Carroll said, and soon the map signaled a success. “Boom, there you go!”
The digital twin is a constant work in progress, a testament to the technology’s capabilities and possibilities.
“I would proudly say we’re the only campus in the United States that does what you’re seeing on the screen right now,” Carroll said. “We have custom built an application with logic, workflows, interoperability, connectivity, and data inputs.”
Carroll zoomed back out. “You can use this in the field, on a desktop, on a mobile phone,” he said. “The whole platform brings everything together.”
Learn more about geospatial digital twins, who uses them, and for what purpose.