
April 7, 2022 | Multiple Authors | GIS for Good
June 18, 2024
When Laurice Walker was recruited as the first chief equity officer at the City of Tucson in 2022, she understood the complexity of the job.
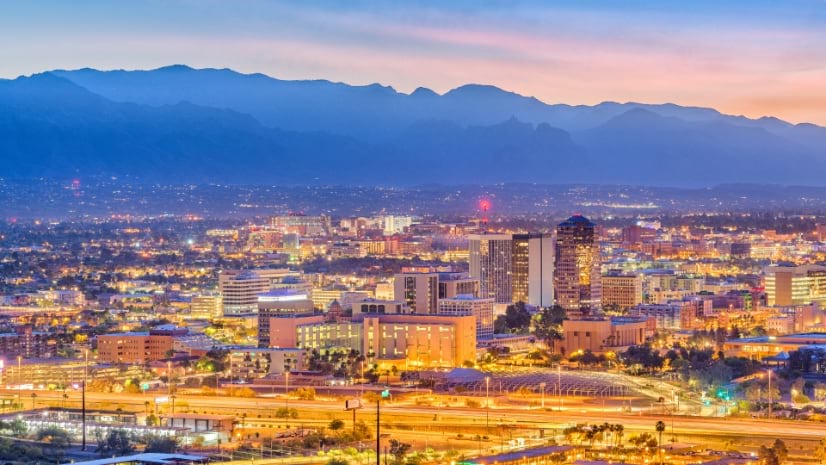
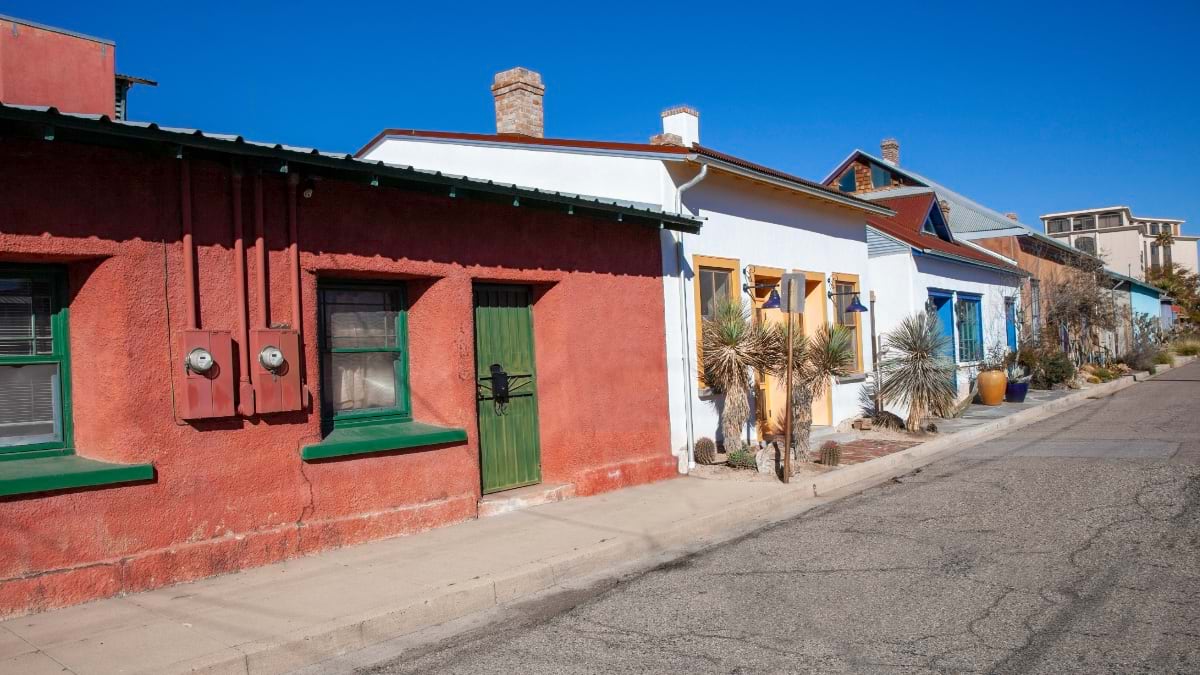
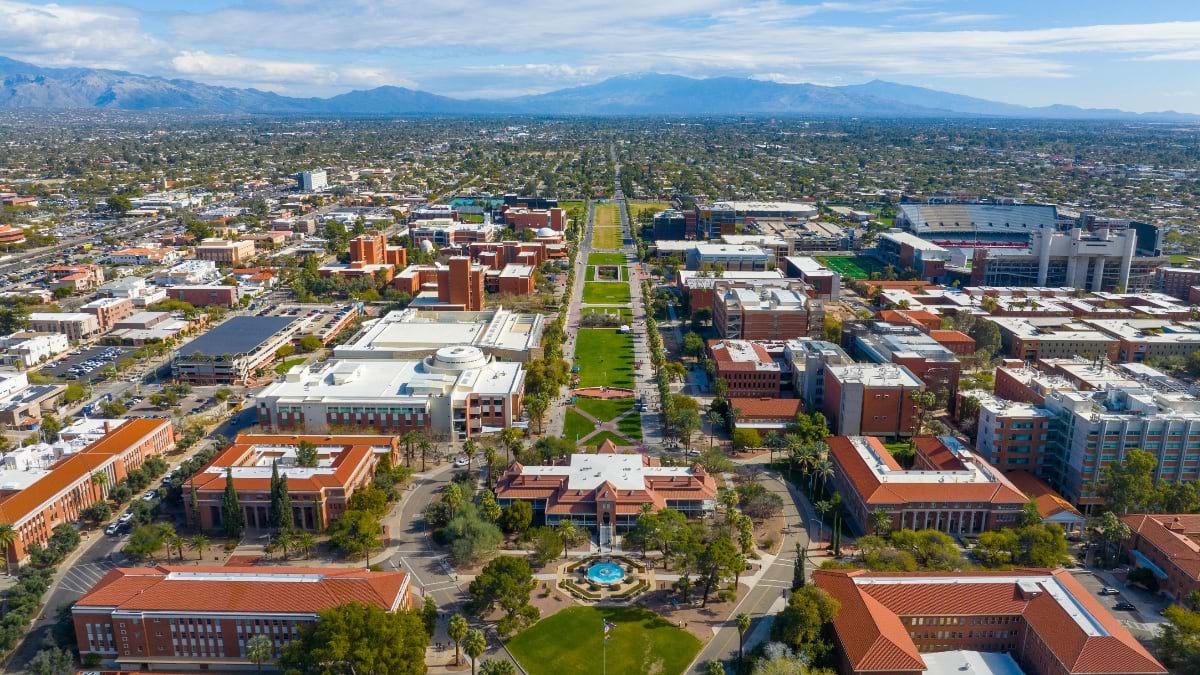
Founded in 1776, Tucson is the oldest and second-largest city in Arizona. Historic neighborhoods, known as barrios, showcase the rich influence of Mexican culture on the region.
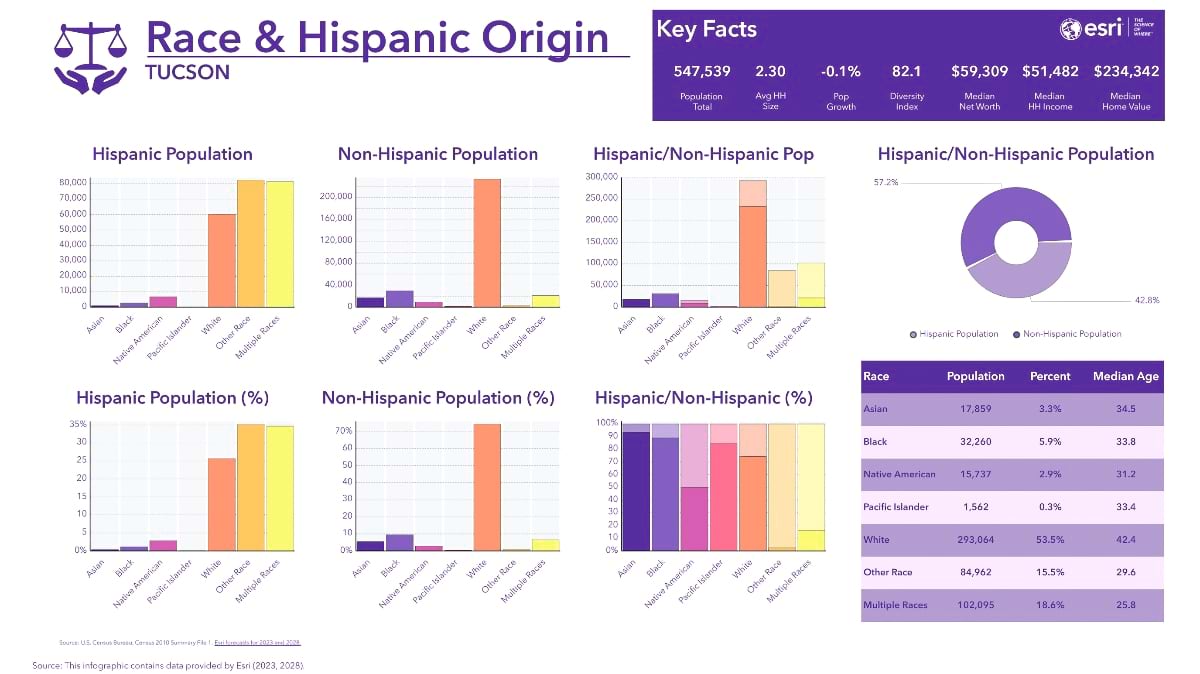
Today, 42 percent of Tucson’s half a million residents identify as Hispanic. Yet, historic racist covenants and redlining have fueled housing injustice in Tucson over the decades, and racial segregation still exists inside city limits. During the 1960s, construction led to the demolition of many culturally rich barrios. For example, in one historic Mexican-American barrio, known as Barrio Libre or La Calle, 1,000 residents were displaced to make room for a convention center. These injustices have sown distrust among some Tucson communities.
Tucson city leadership sought an experienced person to launch the Office of Equity and examine organizational policies, programs, and practices. The primary goal: ensuring accessible city services for all.
“The Office of Equity being created here is a big milestone,” Walker said. “Tucson has shown that it’s truly dedicated to the work of achieving equity.”
Walker had served in a similar pioneering role in Minnesota.
Initiating a new equity strategy would require cross-departmental collaboration and deep public engagement. Walker had to make a nuanced and complicated topic—equity—approachable and easy to understand.
Data held the key.
Specifically, the new office needed demographic data about the characteristics of residents (such as age, race, ethnicity, education, and disability status) and data visualization to show where the most vulnerable lived. Six months after taking office, Walker hired Laura Sharp as the equity data manager.
Sharp quickly applied her background as a geographic information system (GIS) analyst to compile data about people and places. Both Walker and Sharp knew they needed a data-driven approach to enact lasting change.
“Equity is a complex field,” Walker said. “Laura has been able to use GIS to articulate data in a way that is very powerful to our policymakers and the community.” Walker stressed that although demographic data is complex, visualizing it on a map lets people clearly identify burdened populations.
First, Walker and Sharp focused on finding gaps in the availability of city data and resources that could be used for equity purposes. Then, they established strategies to address those gaps. The pair also collected data across city departments to measure equity outcomes and ensure that the demographic data guiding decision-making was up-to-date as well as accurate and consistent.
In early 2024, Walker and Sharp launched the Tucson Equity Data Strategy (TEDS).
TEDS offers a comprehensive plan for the City of Tucson to advance equitable outcomes by collecting, tracking, and analyzing data. The new approach lays out foundational data policies and gives city departments and partners user-friendly tools to advance their equity work. Walker and Sharp also developed demographic collection standards to help city planners, project managers, and other staff collect high-quality data from the public.
“It was important for our work to start with TEDS because it gives people the tools they can use right away,” Sharp said.
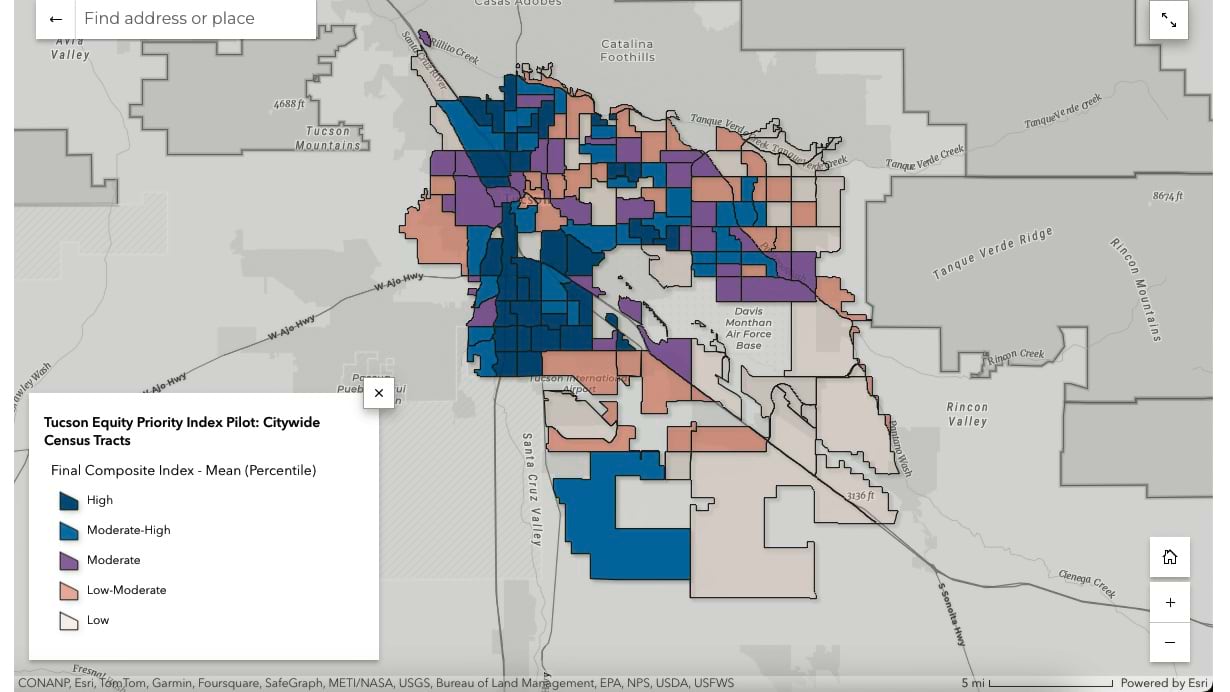
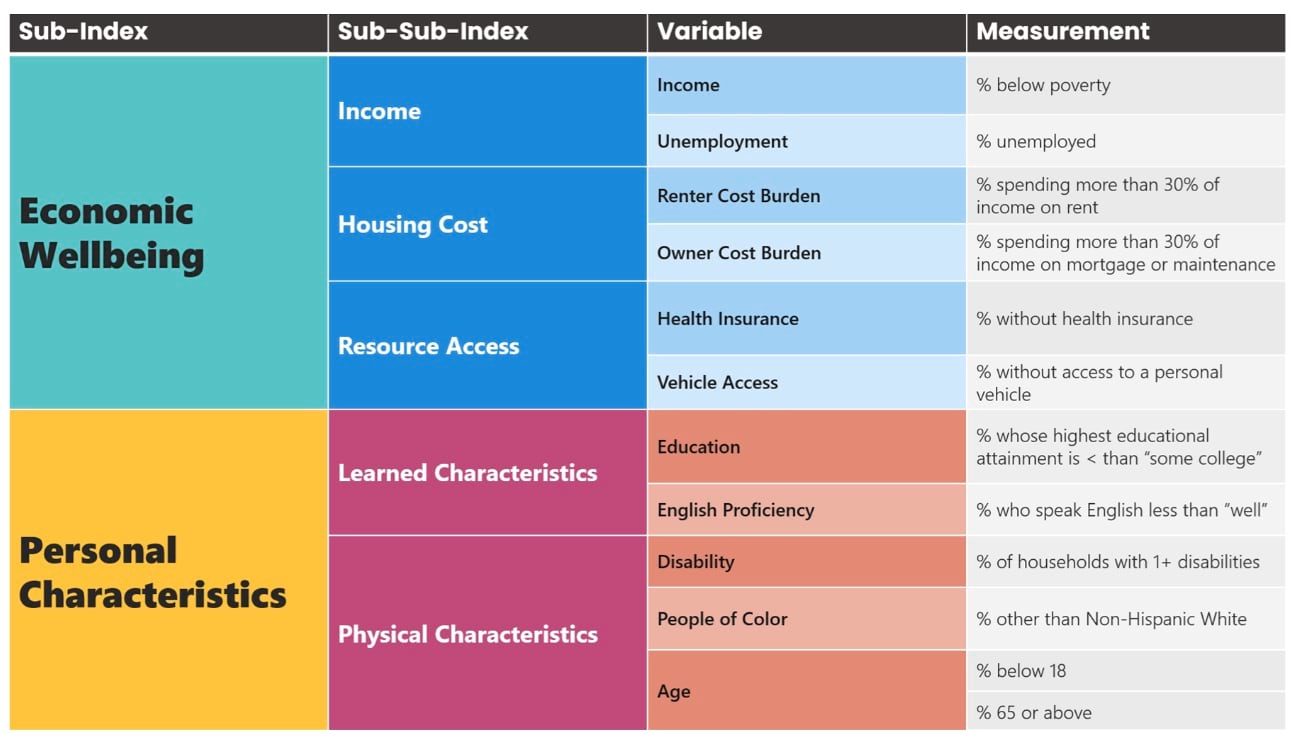
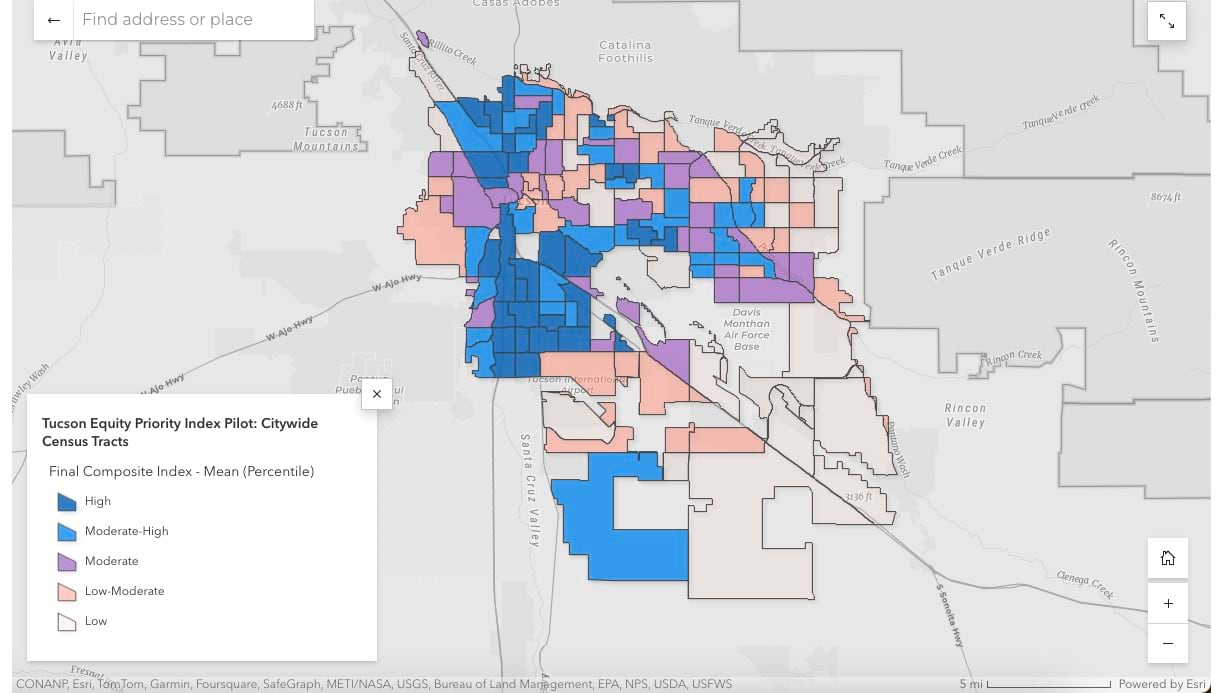
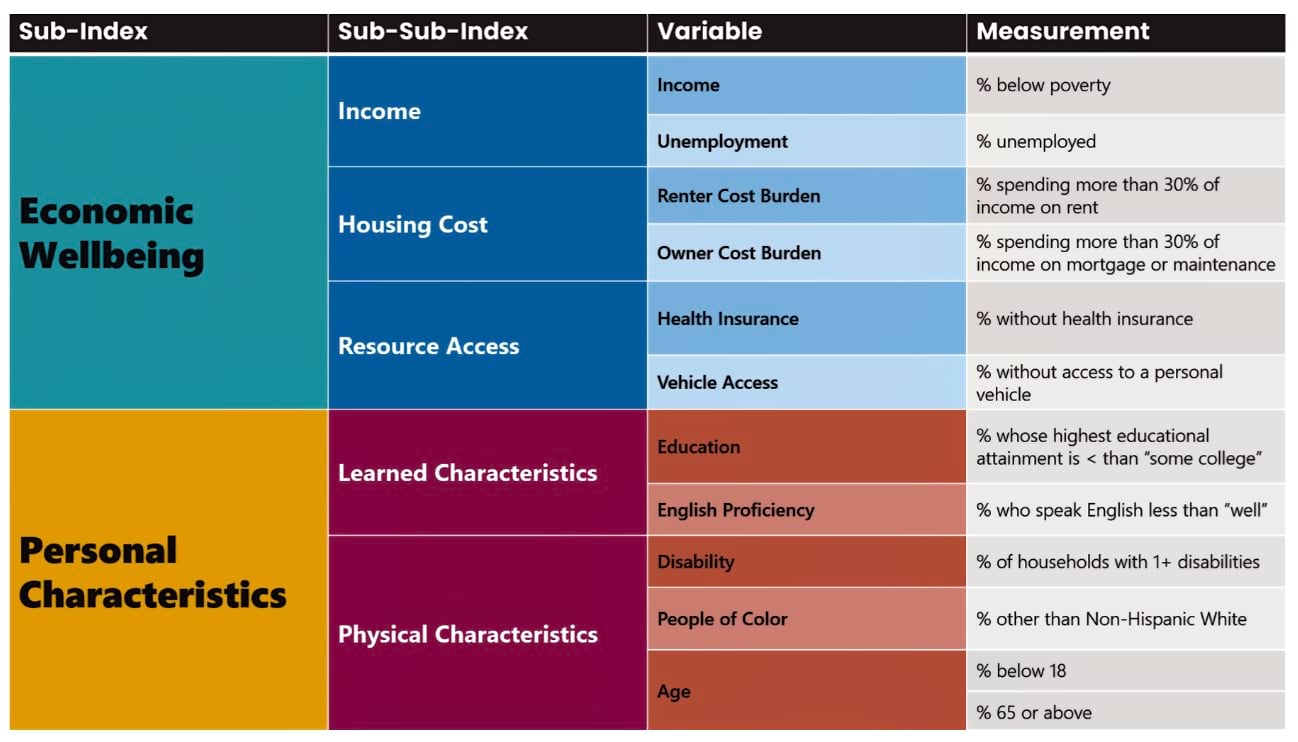
One of those tools is the Equity Priority Index, which combines 11 indicators of social vulnerability. Decision-makers can use these indicators to measure vulnerability and direct assets to areas that will yield the most impact. A composite index gives a complete view of where marginalized communities live and ensures shared awareness across departments.
Income is among the 11 vulnerability indicators included in Tucson’s Equity Priority Index. Nearly one in five Tucson residents live in poverty, and the median household income is $20,000 less than the US national average. Other indicators include unemployment, limited English fluency, and vehicle access.
While equity indexes are not new for Tucson, prior models had shortcomings, such as different variables being used to define vulnerability and no one being assigned to update the demographic data.
Tucson is home to a tapestry of people, including immigrants from Latin America and Africa, University of Arizona students, and seasonal residents. As the population evolves and shifts, so too do the demographics, meaning the data needs to be continually updated.
By taking charge as the authoritative source of this data, the Office of Equity has established a strategic and sustainable way to understand which communities are vulnerable.
Tucson’s new Equity Priority Index can be tailored to support projects in all city departments, like equitable public safety initiatives or water utility equity. The index will also be maintained through data automation, eliminating the need for labor-intensive manual updates. “We wanted to set up processes that can continue on even if the Office of Equity isn’t around to maintain them in the future,” Sharp said.
Most notably, the Equity Priority Index is supported by community feedback. “We’re not just telling people what it means to be vulnerable,” Sharp said. “We’re listening and letting them tell us what being vulnerable means to them.”
Walker understands that vulnerable communities are more likely to be harmed by economic or social issues and can take longer to recover from crises. That’s why she is working to direct assets to vulnerable populations. This will foster citywide resilience and–hopefully—build trust among city leaders and residents.
Over the past three years, the Tucson Office of Equity has done an annual equity budget analysis. Directors from every city department can look at their team’s line-item budgets and find out how their services impact vulnerable populations. Having standardized data, visualized on a dynamic map, gives leaders a clear view of where to direct services, prioritize assets, and fill gaps.
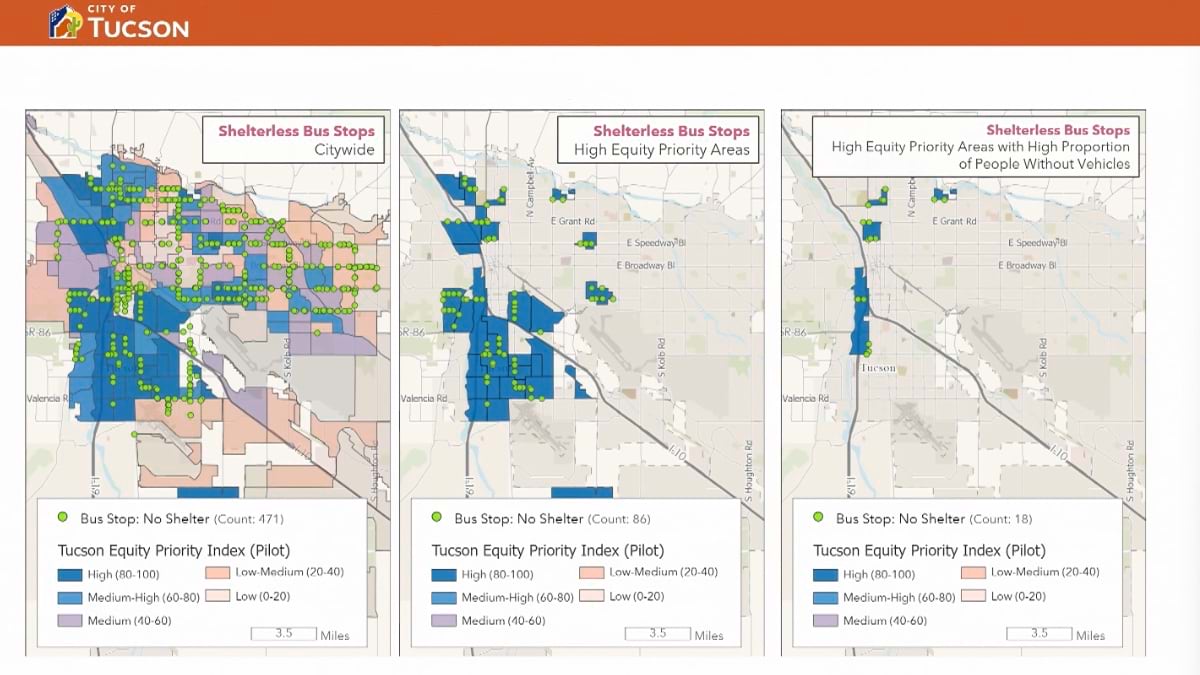
For example, city leaders are eager to use the Equity Priority Index to decide where to construct bus stop shelters. Shade is a commodity in Tucson, with minimal tree canopy and temperatures often exceeding 100 degrees. Since each bus stop shelter costs $30,000, thoughtful prioritization and preliminary analysis are critical. By overlaying bus stop locations against high-priority equity areas that also have a high proportion of people without cars, planners can identify bus stops in the neighborhoods where new shelters are needed most.
Walker and Sharp want the work of the Office of Equity to mend the relationships between marginalized groups and local government.
“Every time a department head comes to us and says, ‘We want to use the index, we see the value,’ it’s a win,” Sharp said. She and Walker believe that changing individual mindsets lays a path for the organizational and systemic changes needed to achieve equitable outcomes. When policymakers and residents alike can see a common picture of the city and the inequities it exposes, it’s much easier to address them.
“Data tells a story. Data has power,” Walker said. “Harnessing that power is key to unlocking equity.”
Learn more about how governments map and analyze marginalized communities with GIS.