May 21, 2024
Tampa Mapped its Most Dangerous Roads to Reduce Deadly Incidents
Each year, 44 people die on average on Tampa’s roads and 289 others sustain life-altering injuries. Recognizing the region’s ranking as the fourth most dangerous US metropolitan area for pedestrians in 2022, Tampa’s leaders set an ambitious goal—and they are already seeing life-saving results.
Through the Vision Zero program, the City is working to eliminate roadway deaths and serious injuries. Tampa’s program is built on a template many cities have adopted as traffic fatalities have climbed nationally for more than a decade.
Powerful analytical tools—maps for visualizing areas of interest and data science to uncover patterns and correlations—help the Vision Zero team understand road conditions and dangers. They use geographic information system (GIS) technology to map and analyze data, identify the most urgent priorities, and design mitigation measures.
“Being able to visualize and better understand the data is a huge help,” said Joshua Cascio, a Tampa communications coordinator. “The Vision Zero Crash Dashboard ensures everyone is on the same page and helps us highlight areas in need of improvement.”
Maps and Data Uncover Risk
Tampa’s GIS analysis found that people walking, biking, or riding motorcycles are more at risk in fatal and serious crashes. Pedestrians, frequently in communities of color, account for 39 percent of deadly crashes—the most vulnerable group. People on foot represent 16 percent of the life-altering injury crashes, which indicates that if a person walking is hit by a car, they are more likely to die than suffer a life-altering injury.
Traffic risk and injury in Tampa follows a national trend. Pedestrian deaths have increased by more than 70 percent since 2010, according to the National Highway Transportation Administration (NHTSA).
The agency noted that more large vehicles are on the roads, especially pickup trucks that have been linked to increasing dangers for people walking. In Tampa, as in other cities, low lighting, speeding and aggressive driving, intoxication, and distracted driving also put people at risk.
The work to reduce deaths and injuries on the city’s roads started with spatial analysis to determine who is at risk and where. Using GIS, planners collected and analyzed local crash data and incident reports. This allowed them to identify and assess Tampa’s most dangerous roads.
The difference between safe and unsafe conditions is difficult to recognize on a spreadsheet. With GIS, planners can create virtual models and visualize project sites on 2D and 3D digital maps. This gives them geographic context to understand site conditions that contribute to risk.
The team answered many questions with GIS, such as:
- Where are higher numbers of fatal and severe crashes occurring?
- What are speed limits in those corridors?
- Are the roads straight, curved, or sloped?
- Do pedestrians have access to safe sidewalks or similar infrastructure?
-
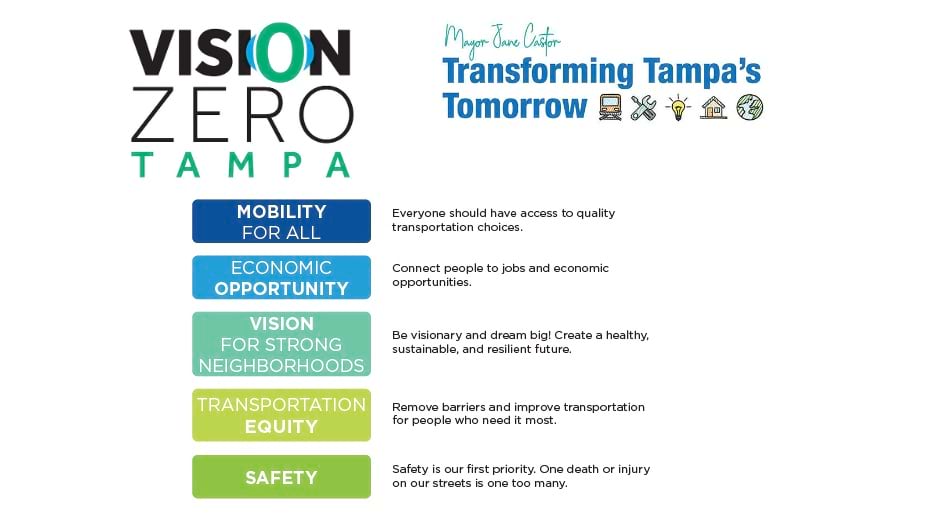
Vision Zero Tampa has a number of goals beyond safety. (Screenshot courtesy the City of Tampa)
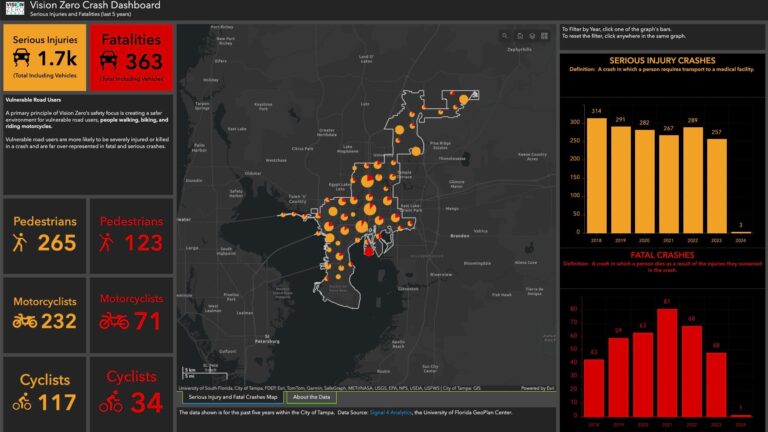
One Vision Zero map is embedded in a dashboard, an on-screen display that brings together multiple types of data for continuous updates and analysis.
The map identifies the location of crashes that have resulted in severe injuries or fatalities over a five-year period.
“We’re taking action by investing in cost-effective measures to make our roads safer and working closely with our community partners,” Tampa mayor Jane Castor said. “And because we know that certain areas are affected more severely, we’re making sure to direct a significant portion of our resources, 74 percent, toward those communities.”
Paths to Improved Safety
By embedding the map in a dashboard, analysts created a public resource in a simple format. Anyone can visit the online site to find up-to-date crash data, including the location and severity of incidents. The dashboard is updated frequently, allowing policymakers to track the city’s progress.
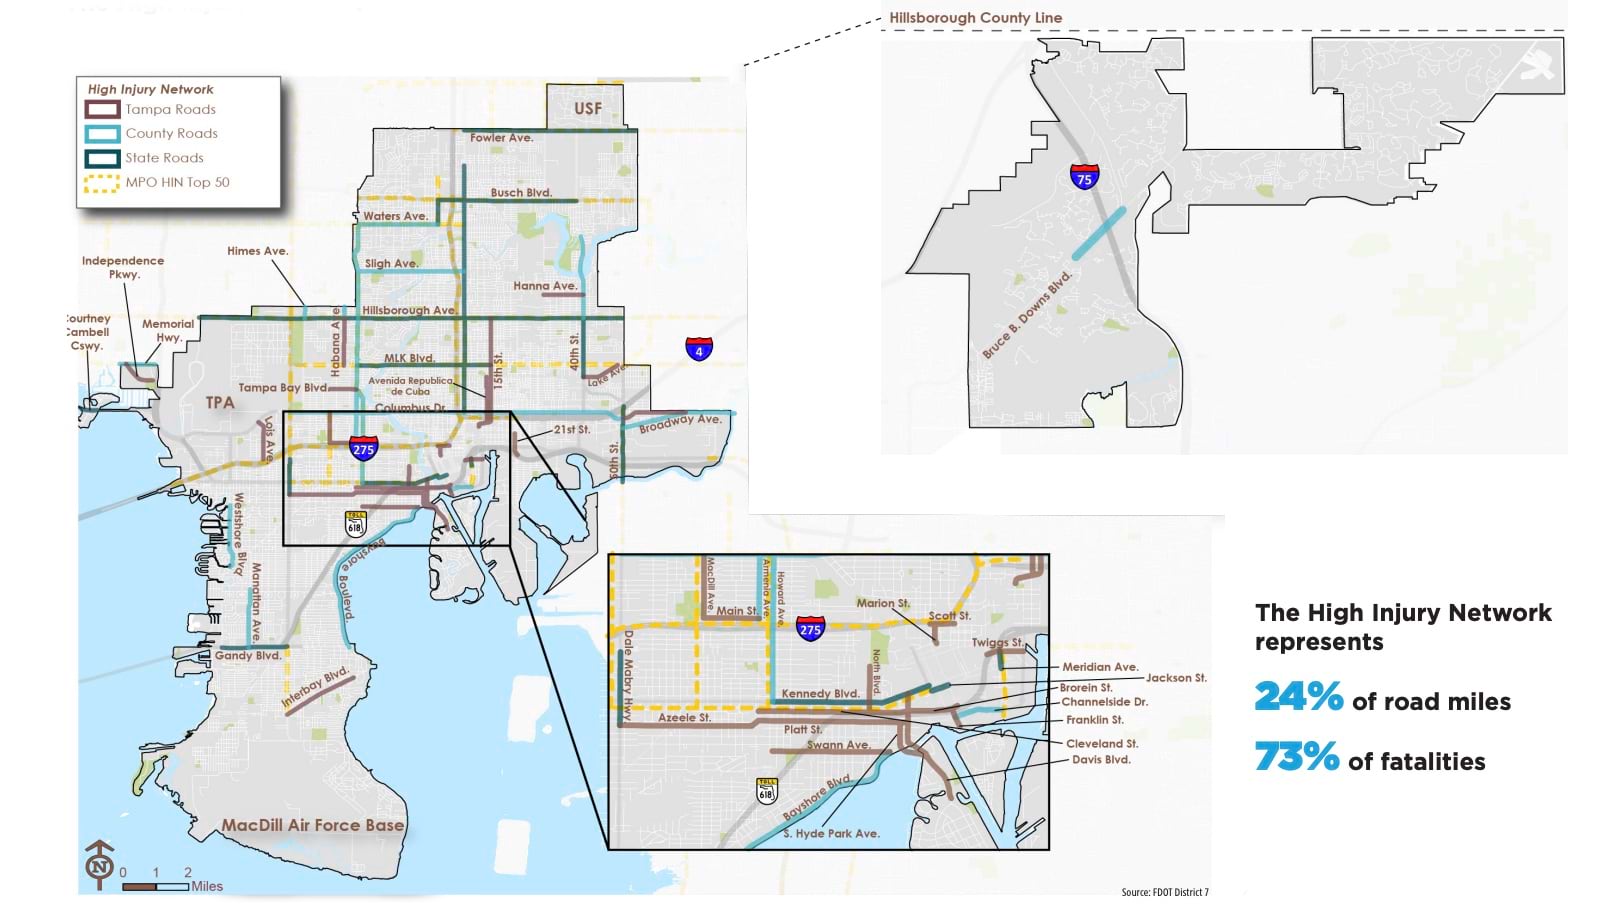
The project team also created an open data map of the High Injury Network as a major component of Tampa’s Vision Zero Action Plan. This map identifies Tampa’s 51 high-injury traffic corridors, which represent 24 percent of the city’s roadway miles. This is where 73 percent of the city’s traffic deaths occur.
The High Injury Network map is a resource government agencies and other organizations can download as a GIS data layer to inform transportation safety projects or other mobility work.
With GIS layers that show the hazardous corridors coupled with data about who lives there, the Vision Zero team developed strategies for improving safety for the most vulnerable road users. These include reducing speed limits, narrowing streets to slow traffic, improving visibility, and adding crosswalks. Infrastructure such as sidewalks and pedestrian islands in the median are other remedies that can protect Tampa’s growing population.
The team also documents traffic volumes, traffic congestion, speed limits, crossing locations, land use, and bike lane data.
Making Tampa’s Streets Safer
Tampa’s work to improve roadway safety is already saving lives and reducing harm to residents and visitors. Traffic deaths have declined from 77 in 2022 to 53 in 2023. The City’s five-year Vision Zero plan includes:
- More rapid deployment of safety improvements through quick-build projects
- Increasing multimodal infrastructure such as a planned streetcar
- Proactive and systemic changes to the physical design of streets
- Installing audible pedestrian signals at crosswalks
The City has resurfaced roadways and added protected bike lanes and other amenities for people traveling on foot and by bike. Vision Zero projects also have improved routes to schools, parks, transit, and food venues.
Work to address the most urgent risks to vulnerable groups will continue with an additional Safe Streets and Roads for All grant of $20 million that the city secured in fiscal year 2022. The city also received a $2.6 million award for fiscal year 2023.
The Vision Zero project teams continue to collect and monitor crash data to determine whether roadway improvements and design changes are effective. The data will also help them modify their strategies where necessary.
City leaders say the Vision Zero approach can be repeated in other communities to save lives and prevent devastating injuries. Las Vegas; San Francisco; Washington, DC; and Louisville, Kentucky all have initiatives built on Vision Zero principles and supported by GIS.
“Any reduction in the number of deadly crashes is a positive thing, but we believe we can bring those numbers down even further,” Cascio said. “It is a team effort, and we are fully committed. We live in one of the most beautiful cities in America, and our residents and visitors deserve our best efforts.”
Learn more about how GIS is applied to build a more equitable transportation system.