
July 30, 2020 |
Christopher Thomas | GIS for Good
After polling centers close on Election Day in Saint Louis County, Missouri, each site’s two supervising staff members place an iPhone in the ballot box, secure it, and travel by police escort to the county’s Board of Elections office.
The iPhone uses geographic information system (GIS) technology to deliver real-time location data that is displayed on a map. Eric Fey, the County’s democratic director of elections, monitors the progression of each box as he waits with his colleagues to receive the night’s final votes and announce election results.
Before using location data, Fey knew that the ballot boxes were on their way but couldn’t pinpoint their precise location. Meanwhile, he would field phone calls from candidates, County personnel, and journalists who wanted updates on results.
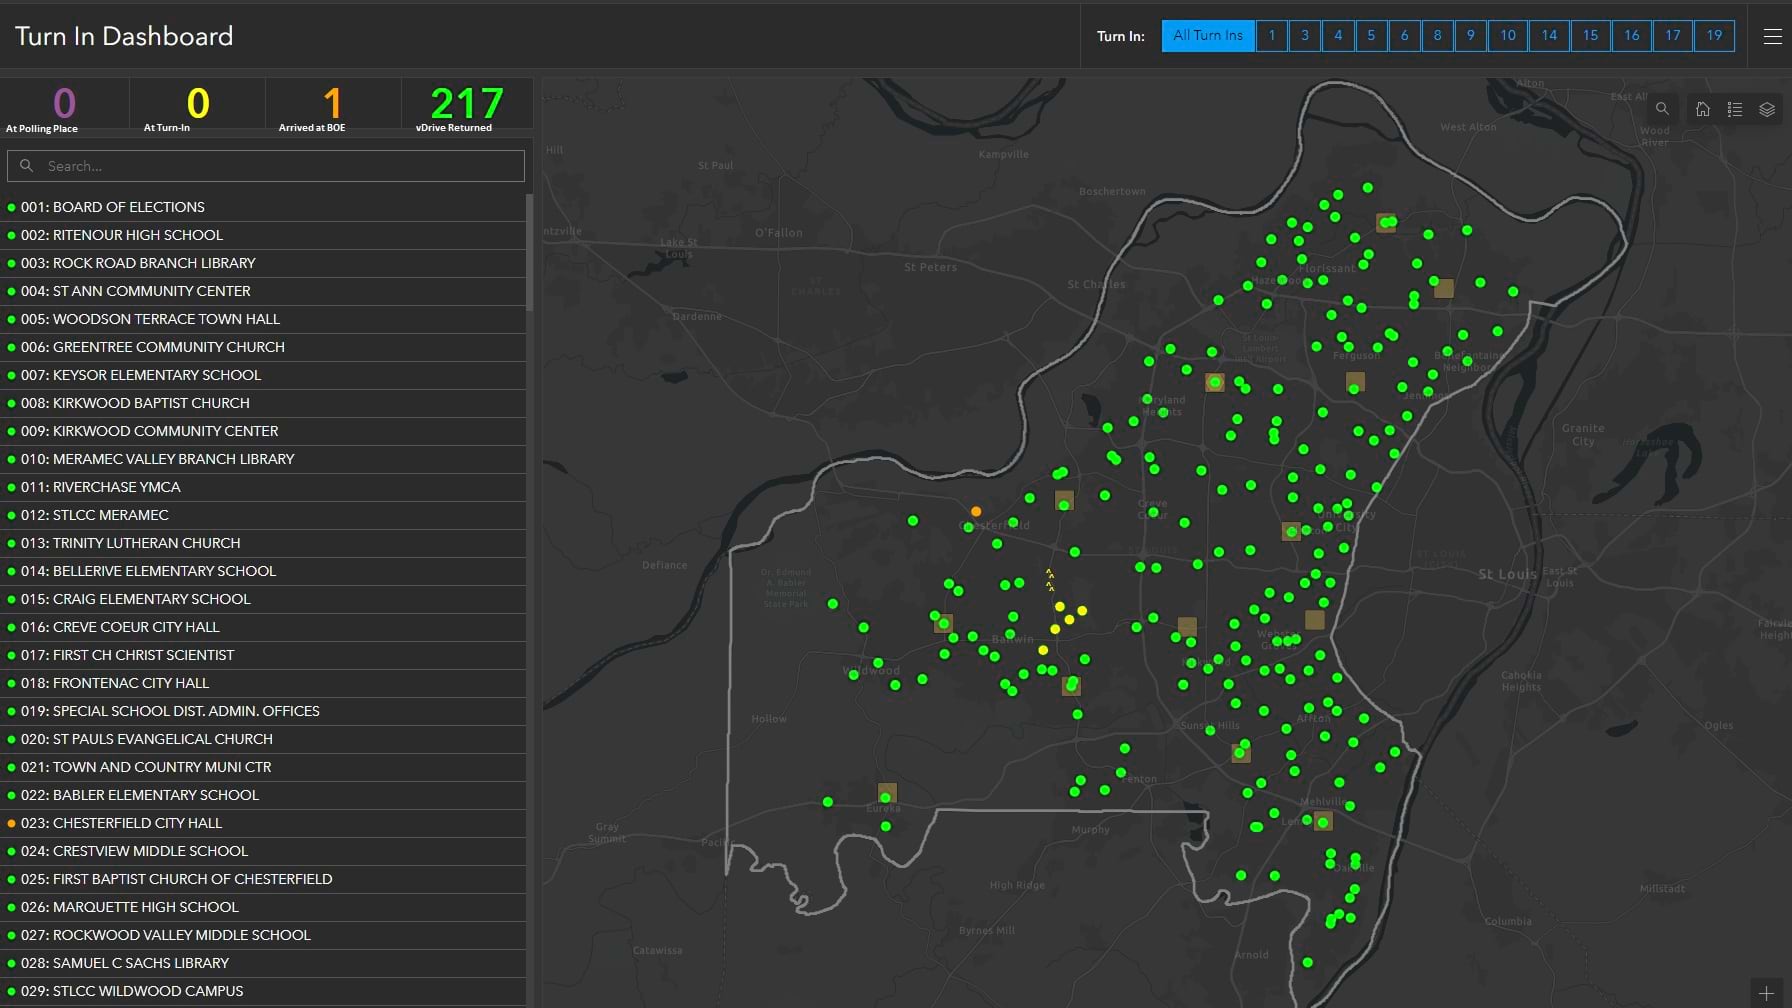
Now, Fey and his team have a dashboard that takes away the uncertainty. “As ballot boxes come back, we know when we scanned them back into the office and when we broke the seal to take the results back to our tabulation room. We can zoom in on specific collection points to see which ones are accounted for and how many are outstanding. We know every part of the process and can visualize it,” he said.
The iPhones that track ballot boxes work in concert with other GIS-powered tools. Together, they provide a complete operational picture throughout the election cycle. A suite of web maps and mobile apps keep officials, candidates, and constituents updated throughout. Then the cycle repeats.
Fey is often asked what he does when there isn’t an election. His answer is surprising: there is always an election. In the coming 18 months, Saint Louis County will host six elections, not including any special elections required by individual city charters.
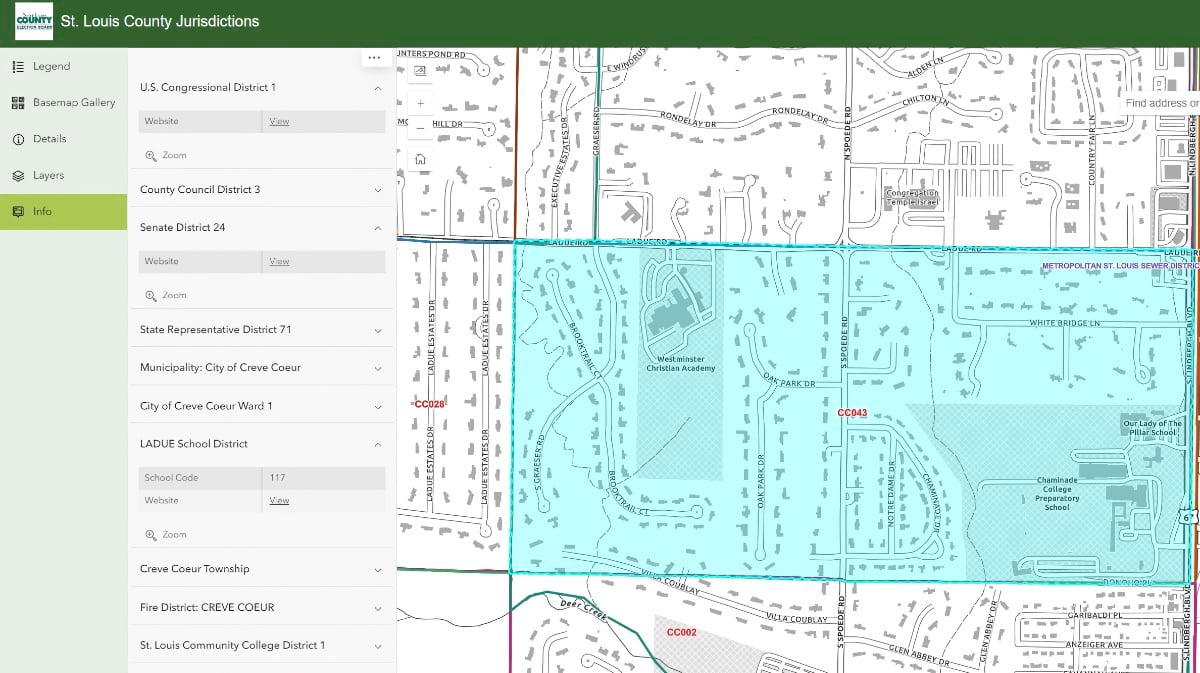
The most populous county in Missouri, Saint Louis County is home to nearly one million people with more than 700,000 registered voters. What makes the region unique is its jurisdictional complexity. On top of the county’s two congressional districts, there are seven county council districts, seven state senate districts, and 30 state representative districts. The county’s 87 cities each have their own elected officials. Voters also elect officials for 24 school districts, 25 fire districts, and a plethora of other special purpose districts.
“We end up with this crazy spaghetti web of local governments and precincts, and it’s our job to make sure people get the correct ballot,” Fey said. “This is a big challenge in election administration. Everyone knows who they want to vote for, for president or governor. But in larger jurisdictions, when you get down to State representative and County commissioner, if someone gets the wrong ballot, they might not even know it.”
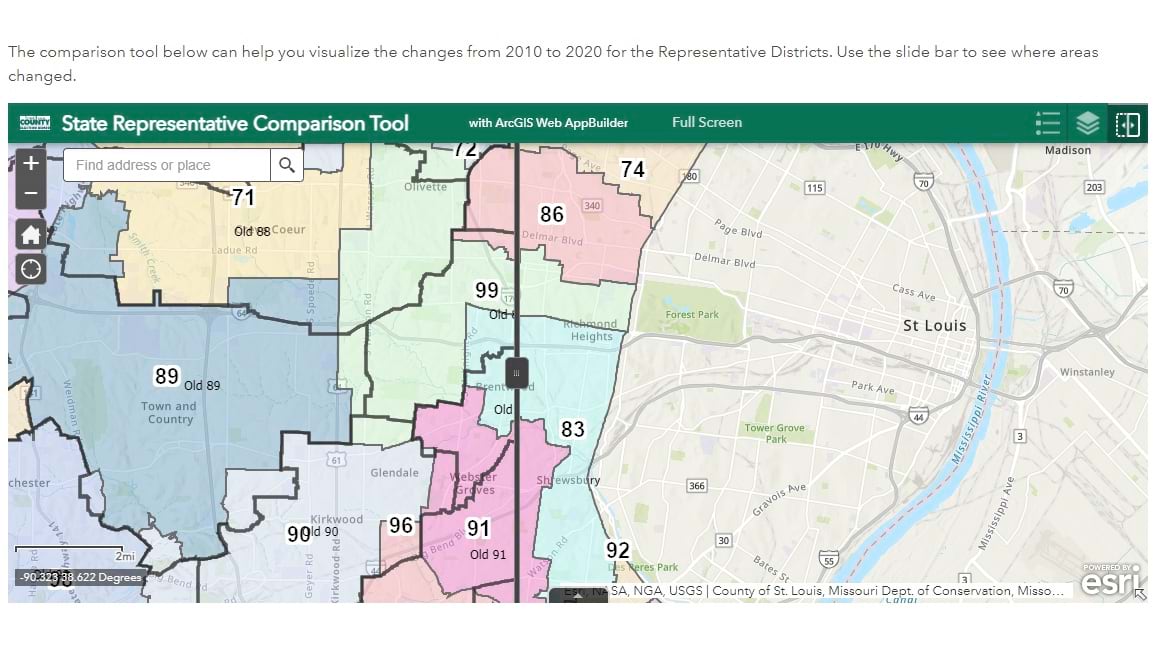
When Fey started working for the County in 2015, Board of Elections personnel were using colored pencils to redraw district lines on paper maps based on new census data. If these boundaries are redrawn incorrectly or aren’t accurately translated into a voter database, errors occur and elections have to be rerun, which is costly for municipalities and their constituents. To solve this, the Board of Elections’ GIS specialists work with judges and redistricting bodies to create digital maps of voting districts.
Now, the maps are available on the Redistricting Hub on the Board of Elections’ website. The resource aggregates all county districts, outlines their boundaries, and shows any recent changes. Most redistricting processes happen every ten years, but if boundaries need to be redrawn, the maps must reflect changes immediately. With the Redistricting Hub, these changes can be easily made and communicated to constituents and stakeholders, including politicians whose district locations and makeup may have shifted.
Recently, new laws in Missouri made it easier for people to vote. Voters can now visit any polling center—instead of an assigned location—or vote as absentees. The Polling Place Lookup tool helps voters find their nearest polling center. For those choosing to vote as absentees, the Absentee Voting Lookup tool highlights satellite sites and calculates driving times to locations where voters can drop off their ballots. Voters can also use the Saint Louis County Sample Ballot Lookup tool to explore the candidates and initiatives specific to where they live.
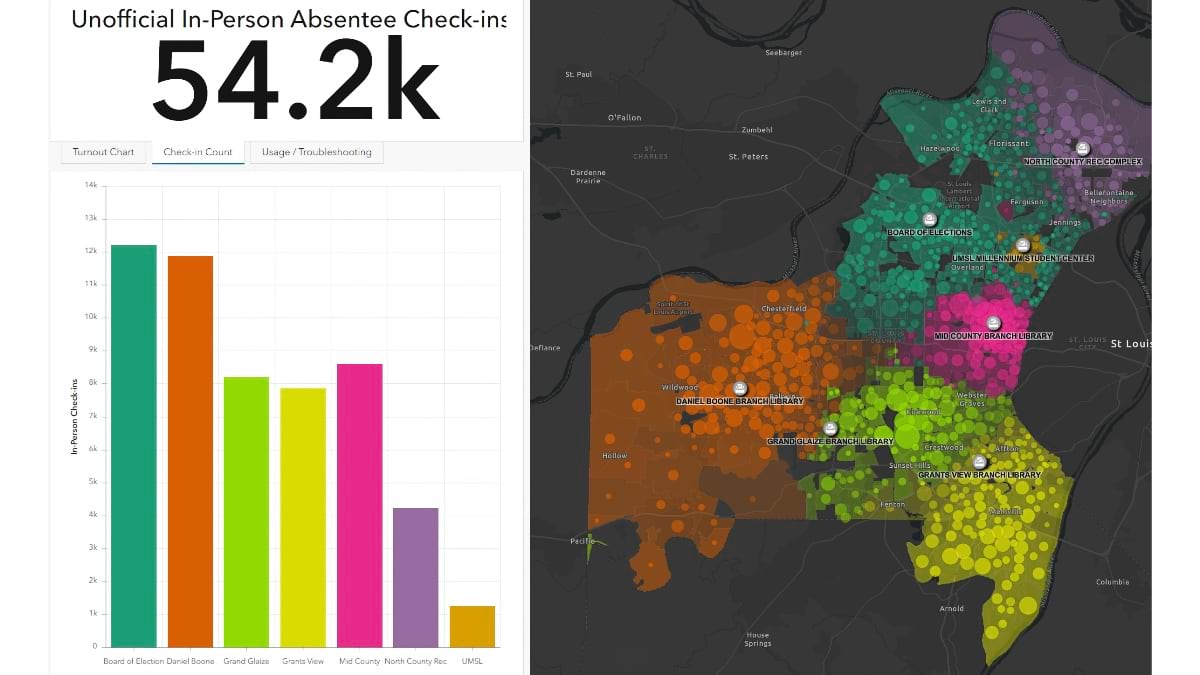
Location technology helps the Board of Elections prepare for these changes. Fey’s team used information from previous elections to determine where to place new sites for early voting.
“Data from the November 2022 election showed us where people were voting. We could also see that there were some dead zones where we didn’t have a polling center. Because there wasn’t one, those people just didn’t vote early, they waited until Election Day—that was a big learning moment for us,” he said.
The Board of Elections is also responsible for distributing voting equipment to nearly 300 polling centers across the county. Prior to implementing GIS technology, warehouse employees would sit down with paper maps and draw out delivery routes. Now, workers optimize delivery routes to find the quickest routes considering traffic conditions and the shortest to minimize travel distance.
The absentee department coordinates voting for residents of nursing and retirement homes, which includes delivering ballots to nearly 100 facilities. “The team [had previously] relied on employees with years of knowledge about the process and it was always confusing,” Fey said. “A few years ago, they went to the GIS analysts and asked for help—that’s when I realized our thinking had really changed. Now we have a dashboard to track and manage the nursing home visits we make. It’s made the job so much easier.”
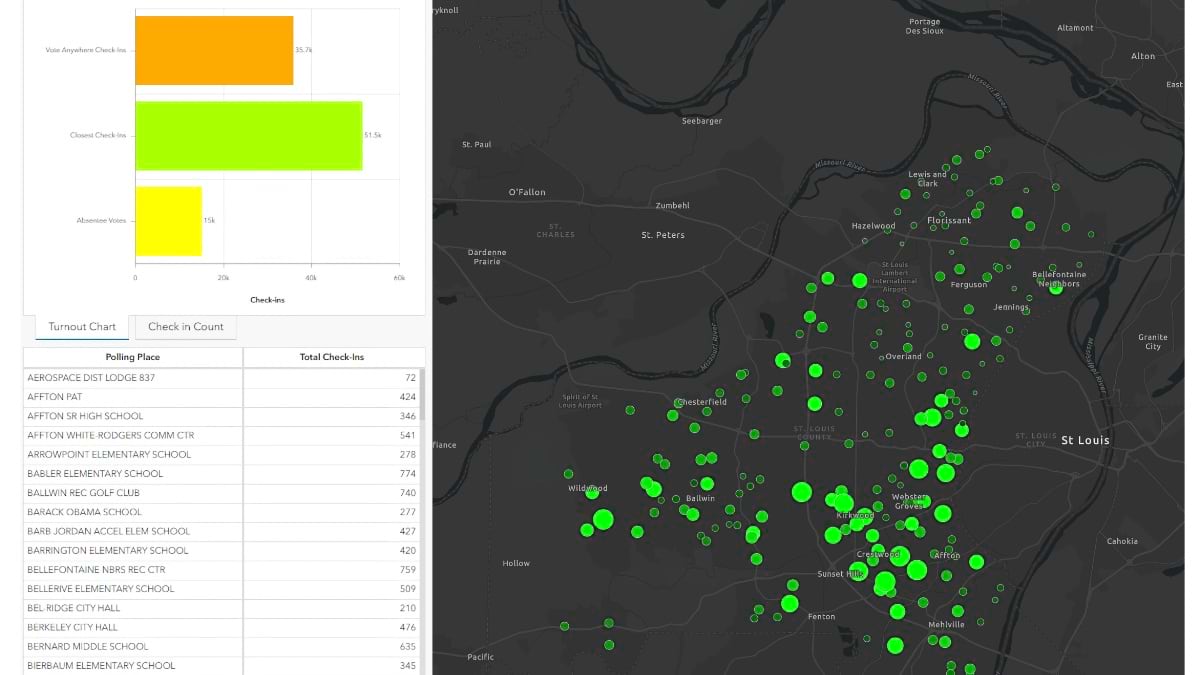
On Election Day, GIS apps keep County officials and constituents informed in real time. Throughout the day, voters can use the Polling Place Lookup tool to monitor wait times at each location. A volunteer counts the voters in line and logs the number in ArcGIS Survey123, which then populates on the web map.
“On Election Day in 2020, we had 365,000 hits to the line tracker app on our website. That’s about as many people who voted on Election Day in Saint Louis County, so it was very popular,” Fey said.
The poll books voters use to sign in are connected to Fey’s office and automatically populate a map that shows where and when people are voting.
Fey and his team monitor polling place wait times to anticipate problems. If a device malfunctions or another error occurs, Fey can locate a mobile team member closest to the issue and dispatch them to troubleshoot.
“Situations can develop rapidly on Election Day and GIS gives us the ability to visualize what is happening,” said Rick Stream, republican director of elections and Fey’s counterpart. “With these tools in place, election days seem somewhat less fraught than they used to be when we could only guess at what was happening in the field.”
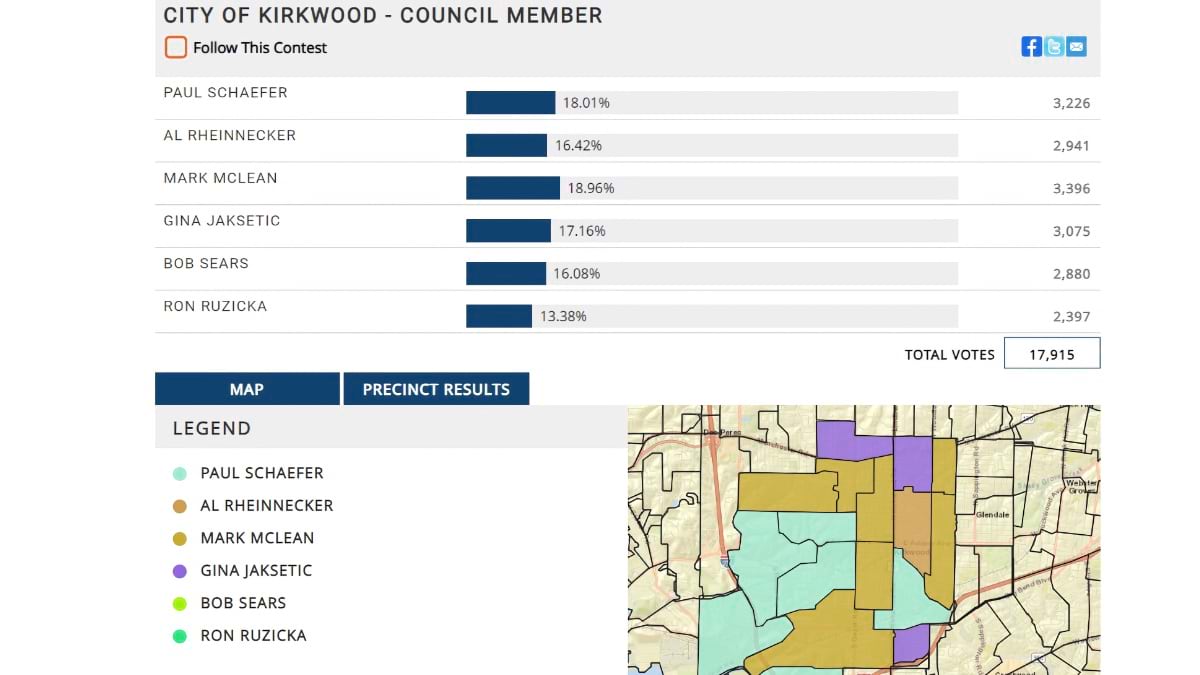
As election results come in, they’re displayed on maps on the Board of Election’s website. Using data, maps, and mobile tools throughout the election cycle grants a high level of transparency and authenticity to the county’s processes. When Fey needs to answer a question, he has authoritative data to point to.
This information matters when addressing allegations of foreign disinformation campaigns, voter fraud, or voting machine security. “New folks are coming into election administration with IT competencies. They want to emphasize outward-facing transparency and make processes more accessible to the public—GIS is a great tool for that,” Fey said.

After each election, staff members aggregate and analyze all the collected data and Fey looks for potential process improvements. If he notices more mobile workers were dispatched to certain areas, he takes note. If a certain polling place is popular, he can allocate additional resources to that location for the next election.
Fey’s office compiles a biennial report filled with maps after every general election. Every elected official receives a physical copy. The reports help officials visualize the regions where they did and didn’t receive support. The maps speak to the large amount of data the Board of Elections collects and synthesizes.
In the future, Fey and his team want to take historic election data and display it on interactive maps for constituents, researchers, and journalists to explore. He’s also hoping to enhance real-time data collection on Election Day to include interactive maps with live results, down to the precinct level.
They are ahead of the curve. According to the National States Geographic Information Council, the majority of states are in the early stages of integrating GIS into their election processes. Fey noted that, by focusing on hiring GIS personnel and investing in the tools they need, the Board of Elections created a culture where people use location data to solve problems and innovate. “It’s these little improvements,” Fey said. “Every little piece builds on something else.”
Learn more about how GIS is used to modernize elections and the growing interest in using GIS for election security planning.