December 10, 2024

Thawing permafrost is a risky climate wild card. Researchers and locals are trying to change that.
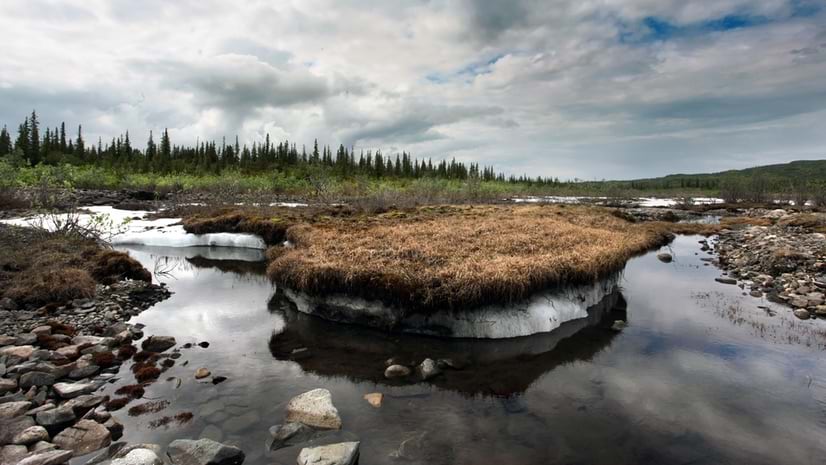
Across the Arctic, the perennially frozen ground called permafrost is quickly disappearing. Roads crack apart, the foundations of buildings split, and shorelines disappear overnight. As the land sinks and craters, an estimated four million people across the top of the world are at risk. Whole communities have begun to relocate, and others are making plans. The thawing has been going on for decades, but now there’s a greater urgency: The region is warming up to three to four times faster than anywhere else on Earth.
To make matters worse, the thawing permafrost can accelerate global warming. Defined as ground that is continually frozen for at least two years, permafrost underlies about 15 percent of the Northern Hemisphere land area, and stores an estimated 1.6 trillion metric tons of organic carbon, twice the amount currently held in Earth’s atmosphere. As the thaw unleashes more buried carbon, the gases feed a perilous feedback loop that’s speeding up the permafrost’s own demise.
And yet, just how quickly this collapse will continue to happen—and what that means for people and the planet—remains something of a climate mystery.
Researchers are using geographic information system (GIS) technology to record changes, model the impacts on people and the environment, and forecast future scenarios. And locals have been coping with the changes for decades, said Susan Natali, a scientist at the Woodwell Climate Research Center, in Falmouth, Massachusetts. However, “There is a lot of uncertainty right now in understanding what’s happening at the pan-Arctic scale,” she said. And “you can’t respond to a problem unless you know how to target your response.”
Taking stock of the changes is the mission of Permafrost Pathways, the initiative Natali leads. Launched in 2020 with $41 million in funding through the Audacious Project, the first-of-its-kind initiative is focused on tracking the rate and impacts of thaw, helping communities adapt to those impacts, and informing the global policies that could help address the problem. With a wealth of data from space, aircraft, and ground-based sensors, along with field measurements and close collaboration with locals, Natali and her colleagues are building the closest thing there is to a living map of the permafrost and its effects.
“How do we understand what’s going on in the North? How do we scale it up from local observations and point measurements? And how do we understand what this means for global climate and for the landscape and the plants and the people who are living on it?” Natali said.
This isn’t simple. Greenhouse gases can be hard to measure across a vast landscape. Because it’s dark for one half the year and cloudy for the other, it’s difficult to get a good satellite image. And the permafrost is thawing unevenly, fueled by a complex web of factors, including temperature, forest management, and the Arctic’s increasingly frequent wildfires.
Two stark signs of the problem are retrogressive thaw slumps (RTSs) and gas emission craters (GECs) that dot the shifting landscape. Ranging from a few meters to dozens of meters deep, these abrupt thaw features can swallow houses and roads and threaten local ways of life. They also spit out centuries of greenhouse gases, including explosive methane—alongside evidence of prehistoric human populations, ancient microbes, and the occasional frozen mammoth.
The largest RTS in the world is the Batagaika Crater in northeastern Siberia, Russia. The mega-slump began to form in the 1960s, following clear-cutting of a section of forested area. Now half a mile long, with walls as high as 300 feet, it’s growing at a rate of as much as 100 feet annually. Locals call it the “gateway to hell.”
“In some of these abrupt thaw features, the thawing and eroding hillslope can get very mucky. You’ve got to move, move, move, or you start to sink,” Natali said.
One kind of permafrost that sinks into thaw slumps—called yedoma—is rich with ice and frozen organic matter, so its deep, ancient deposits of carbon can unleash substantially more greenhouse gases into the atmosphere than other kinds of permafrost. “Once they are triggered, those abrupt collapses further accelerate thaw,” Natali said. “They can also double the permafrost carbon feedback.”
Still, environmental policy doesn’t fully account for the climate impact of the thawing. To have a shot at limiting warming to one and a half degrees centigrade above preindustrial levels, the United Nations’ Intergovernmental Panel on Climate Change said in 2018 that humans must stay within a carbon budget of roughly 580 billion tons. The panel’s models have only recently started to incorporate the possible effects of permafrost thaw, which some estimate could release as much as 150 billion tons of carbon alone by 2100. And yet, said Natali, the models still tend to miss the impacts of the abrupt thawing that leads to slumps like Batagaika.
“Even if nations were fully prepared to reduce emissions to stay below 1.5 degrees centigrade, without accounting for permafrost we won’t be able to stay below this climate threshold,” Natali said.
To help visualize some of the factors driving thawing this year Permafrost Pathways launched an interactive mapping app. Called the Thawing Arctic-Boreal Zone, or TABZ, the app uses 40 years’ ground and satellite data to show decades of temperature and frozen ground trends at any coordinate in the North. Built with help from Esri, the idea is to let anyone explore the warming patterns that are contributing to many of the Arctic’s often-overlooked environmental risks, including thaw, flooding, and wildfire.
The app, however, only offers approximations of the trends, and can’t illustrate the actual impacts of the thaw. To build a more detailed picture, researchers are using field measurements like permafrost coring and soil sampling, and monitoring greenhouse gases with a network of sensor towers. They’re also mapping wildfire and abrupt permafrost thaw—to do this, they’re using what optical and synthetic aperture radar data they can get from satellites, along with Esri’s regularly updated basemaps, and modeling trends using cutting-edge machine learning models.
Efforts to track Arctic changes have been afoot for decades—but not with this kind of breadth, coordination, and collaboration. “Nobody has done this at such high resolution,” said Greg Fiske, Woodwell’s senior geospatial data analyst and the project’s mapping guru.
“Permafrost thaw can be as big in the next hundred years as the emissions from China, or it could be much, much smaller,” he adds. “We don’t know. And just the concept that we don’t know is the issue here.”
To calibrate the overhead data and build an even more detailed picture of the thaw, the researchers rely on another set of data: the intimate knowledge of the vanishing land from the often Indigenous communities that live with it.
The information that Permafrost Pathways produces is ultimately aimed at leading to decisions and policies that will help the local residents to respond and adapt to the thaw. “And of course, that’s useless if you don’t include the input of the people on the ground in those places,” Fiske said.
For millions of people—from the Tibetan Plateau to Siberia; from the Himalayas to northern Greenland; and in the Northwest Territories, Yukon, Nunavut, and Nunavik in Canada; and in Alaska—the problem of the thaw is immediate. One hundred forty-four Alaska Native communities alone—43 percent of all communities across the state—are now imminently threatened by permafrost thaw, flooding, and erosion.
“The different communities in Alaska and across the Arctic are in different phases in terms of what they need to do to deal with this,” Natali said. “Is it managed retreat? Do you have to move some homes? Is it whole community relocation? These are some of the very difficult questions that Arctic communities are facing today.”
One of the 10 communities Permafrost Pathways works with is Kuigilnguq (pronounced kwee-gill-in-gawk), a Native Village of about 300 people on the coast of southwest Alaska. Kuigilnguq residents are working to relocate homes and infrastructure because of increased flooding and permafrost thaw. Search for Kuigilnguq on the map app, and you can see it has warmed ~1.03 degrees centigrade each decade over the last 20 years and lost approximately three days of frozen ground each decade.
To build a more fine-grained picture of the changes in this part of the world, researchers have installed carbon flux sensors and are flying drones equipped with lidar and thermal sensors, which can help build 3D digital surface models. But here, as in other communities, the work always begins with a conversation over a map.
“It’s a pretty fascinating thing to walk into a small community in Alaska and put a satellite image on the table. The folks around the table will immediately start talking and sharing stories,” Fiske said.
“The folks we work with may not know how to use ArcGIS, but they are geospatial experts. They know their land better than anyone. We quickly have a common language of mapping, and things move rapidly from there,” he added.
Historical spatial data in the Arctic can be hard to obtain, split up as it tends to be among different government entities—if it exists at all. By mixing new data with decades of Indigenous Knowledge, “you start to get the true answers to our questions,” he said. “I go into these places thinking I know what is on this map, and I don’t know anything.”
During one meeting in a small community in the Alaskan southwest, Fiske began by placing a satellite image from the mid-1980s next to a present-day satellite image. Surprisingly, the locals weren’t very interested in the newer image. “They all just stood there and reminisced, and they could start pointing out places to fish, where the river was, how there was very little wet ground and there was a lot of high dry ground for their homes,” he recalled. “It was visceral and heart-wrenching to hear their stories.”
Through training in data collection and GIS, Permafrost Pathways helps empower locals to independently monitor permafrost change, ensuring that they have the information needed to respond to potential infrastructure and safety threats. In villages that are planning on relocation, the research can inform community efforts to work with state and federal governments and create funding mechanisms that don’t yet exist.
Among the communities he’s visited, Fiske has seen an existing interest in learning how to use geospatial tools to make policy arguments. “You can have somebody else make a map for you, or you can make your own map of your own community, and it’s much better to do the latter,” Fiske said.
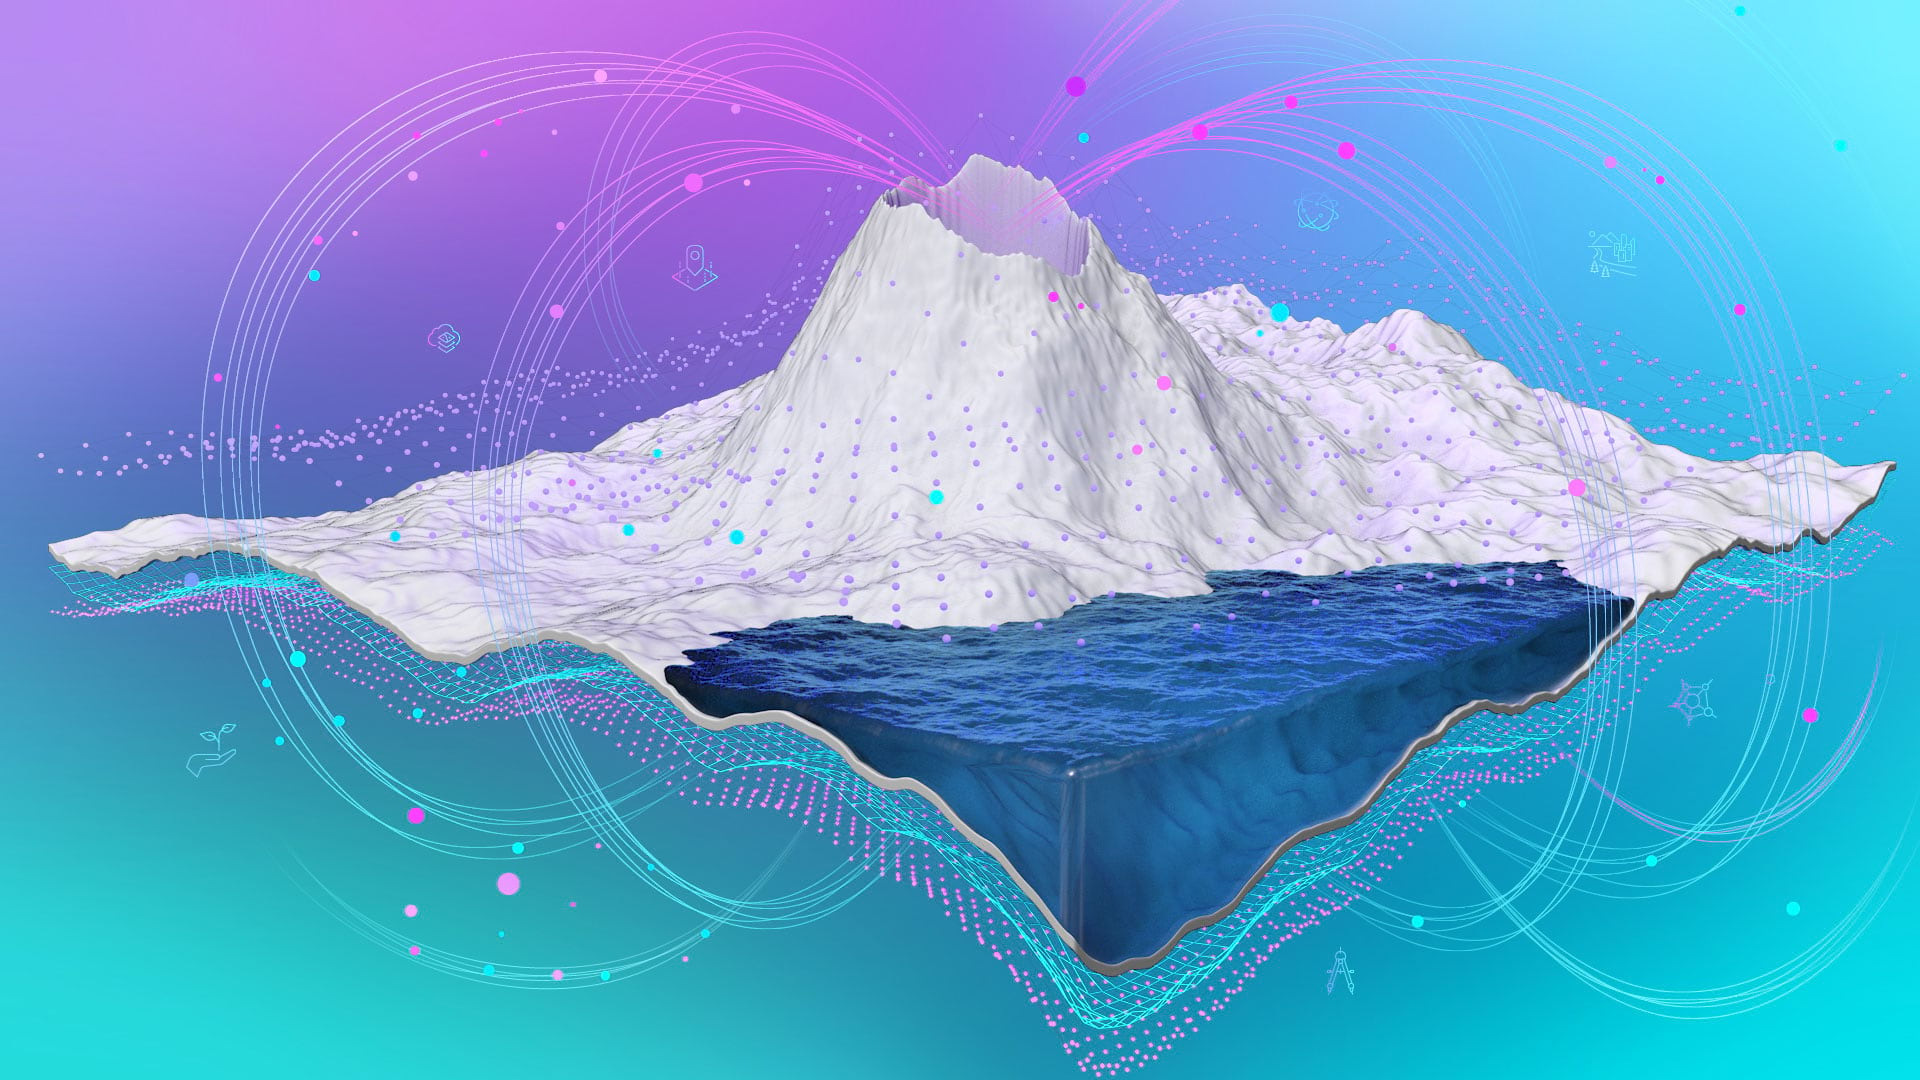
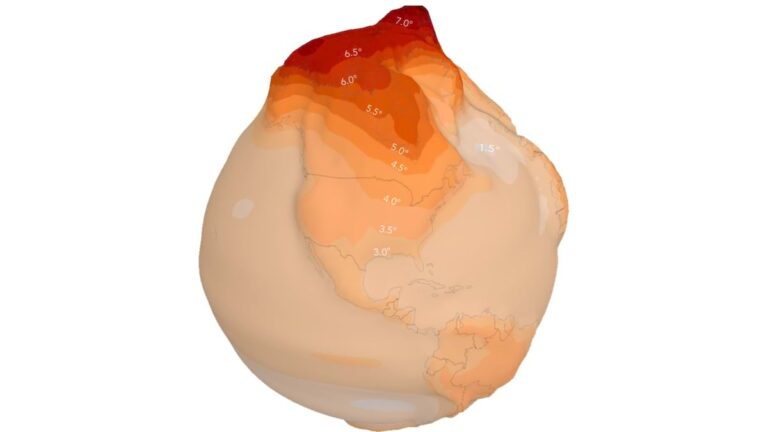
Fiske has been trying to alert the public and policymakers with his own, more specialized maps of the permafrost. One eye-catching map, based on a business-as-usual climate scenario over the next three decades, visualizes projected temperature change as elevation on the map. The higher the elevation, the greater the warming.
“The top of the planet, which is the Arctic, has this big mountain on it, and that mountain represents the disproportionate warming that has happened there in relation to the rest of the planet,” he said. “I call it Distorted Earth.”
Alaska is only one piece of the permafrost puzzle; 60 percent of the Arctic is located in Russia. But new restrictions, imposed after Russia’s invasion of Ukraine, have prevented US and European funding from flowing to Russian research institutions. For Permafrost Pathways, that has meant finding other ways to collaborate with the project’s colleagues in Siberia and, in the meantime, focusing more on its collaborations with partner communities in Alaska that are experiencing the thaw on a daily basis.
Amid the enormity and complexity of the permafrost problem—and all the high-tech data, tools, and maps—it’s the human impacts that occupy and motivate Fiske and Natali the most.
“It’s a really, really challenging issue when the amount of land that is suitable for a community to meet their cultural, ecological, spiritual needs is shrinking because of decisions made and actions taken elsewhere in the world,” Natali said.
“And that is a now problem. That is not a distant problem. That is a here and now problem that needs a locally led and globally supported response.”
Learn more about how GIS supports climate action, and how GIS safeguards biodiversity. For more on the use of GIS in the Arctic, listen to this episode of The Esri & The Science of Where podcast.

