July 11, 2024

Over the years, Sandy Springs, Georgia, has woven a unique tapestry of stories about itself.
The opening of the Interstate 285 expressway in the 1960s connected this rural area into an inner-ring suburb of Atlanta. Attempts by Atlanta leadership to annex the area encountered fierce resistance. Sandy Springs remained an unincorporated area of Fulton County for over 40 years until voters overwhelmingly approved to incorporate the city in 2005.
Today, Sandy Springs is one of the fastest-growing cities in the Atlanta metro area. Half the city’s housing stock is apartments, making it an attractive alternative to young people who can’t afford Atlanta’s rising home prices. Only a few cities in the US have more Millennial new residents.
The city’s leadership embraces this growth and strives to build the kind of city these newer arrivals desire, ensuring that rapid growth does not jeopardize existing communities. This commitment to inclusivity and balance requires a constant dialog with those who run the city and the residents they serve. A geographic approach, utilizing smart maps generated with geographic information system (GIS) technology, is instrumental in helping city planners visualize, communicate, and moderate this discussion.
The Crossroads neighborhood, a vibrant community centered around the intersection of Georgia State Route 9 and I-285, is a compelling case study in the city’s diligent efforts to balance interests of residents and newcomers. This neighborhood is a microcosm of the city’s diversity and the challenges it faces in managing growth while preserving unique character.
The west side of State Route 9 is home to a Hispanic community with deep roots in Sandy Springs. “A big concern is gentrification and the threat of being priced out of existing communities,” said Tyler Lents, a GIS expert who works for the City of Sandy Springs.
Crossroads is the location of The Prado, a large shopping area that includes offerings such as Life Time Work, which bills itself as “North Atlanta’s only integrated coworking space and health club experience designed with your mental and physical health in mind.” Across the street from the mall is El Taco Veloz 2, an outpost of Atlanta’s oldest taqueria.
That geographic juxtaposition—an established local institution and a work/wellness facility for remote office workers—hints at the growth-related challenges Crossroads residents and the City of Sandy Springs must navigate.
Lents uses US Census data and GIS technology to reveal how certain inequities within Sandy Springs—such as poverty and lack of insurance—are concentrated within Crossroads.
“I knew much of that would show up there, but it’s easier to see if it’s mapped,” he said.
The maps he created helped public safety officials understand the connection between geography and vulnerability. For example, the maps revealed, in stark terms, the large number of households at risk from flooding by Long Island Creek, a tributary of the Chattahoochee River.
In early 2023, local officials began holding community meetings to discuss Crossroads’s future. To promote transparency and build consensus, the city made 3D maps available, allowing residents to visualize proposed changes.
These events culminated in the Crossroads Small Area Plan, adopted by the City Council in December. It detailed how the city plans to protect and rehabilitate neighborhood housing stock, increase open space, improve walkability, and promote mixed-use zoning.
Some of the recommendations are uncontroversial. Few would object to improving pedestrian safety around Roswell Road, especially for kids who walk under the I-285 overpass to reach their school.
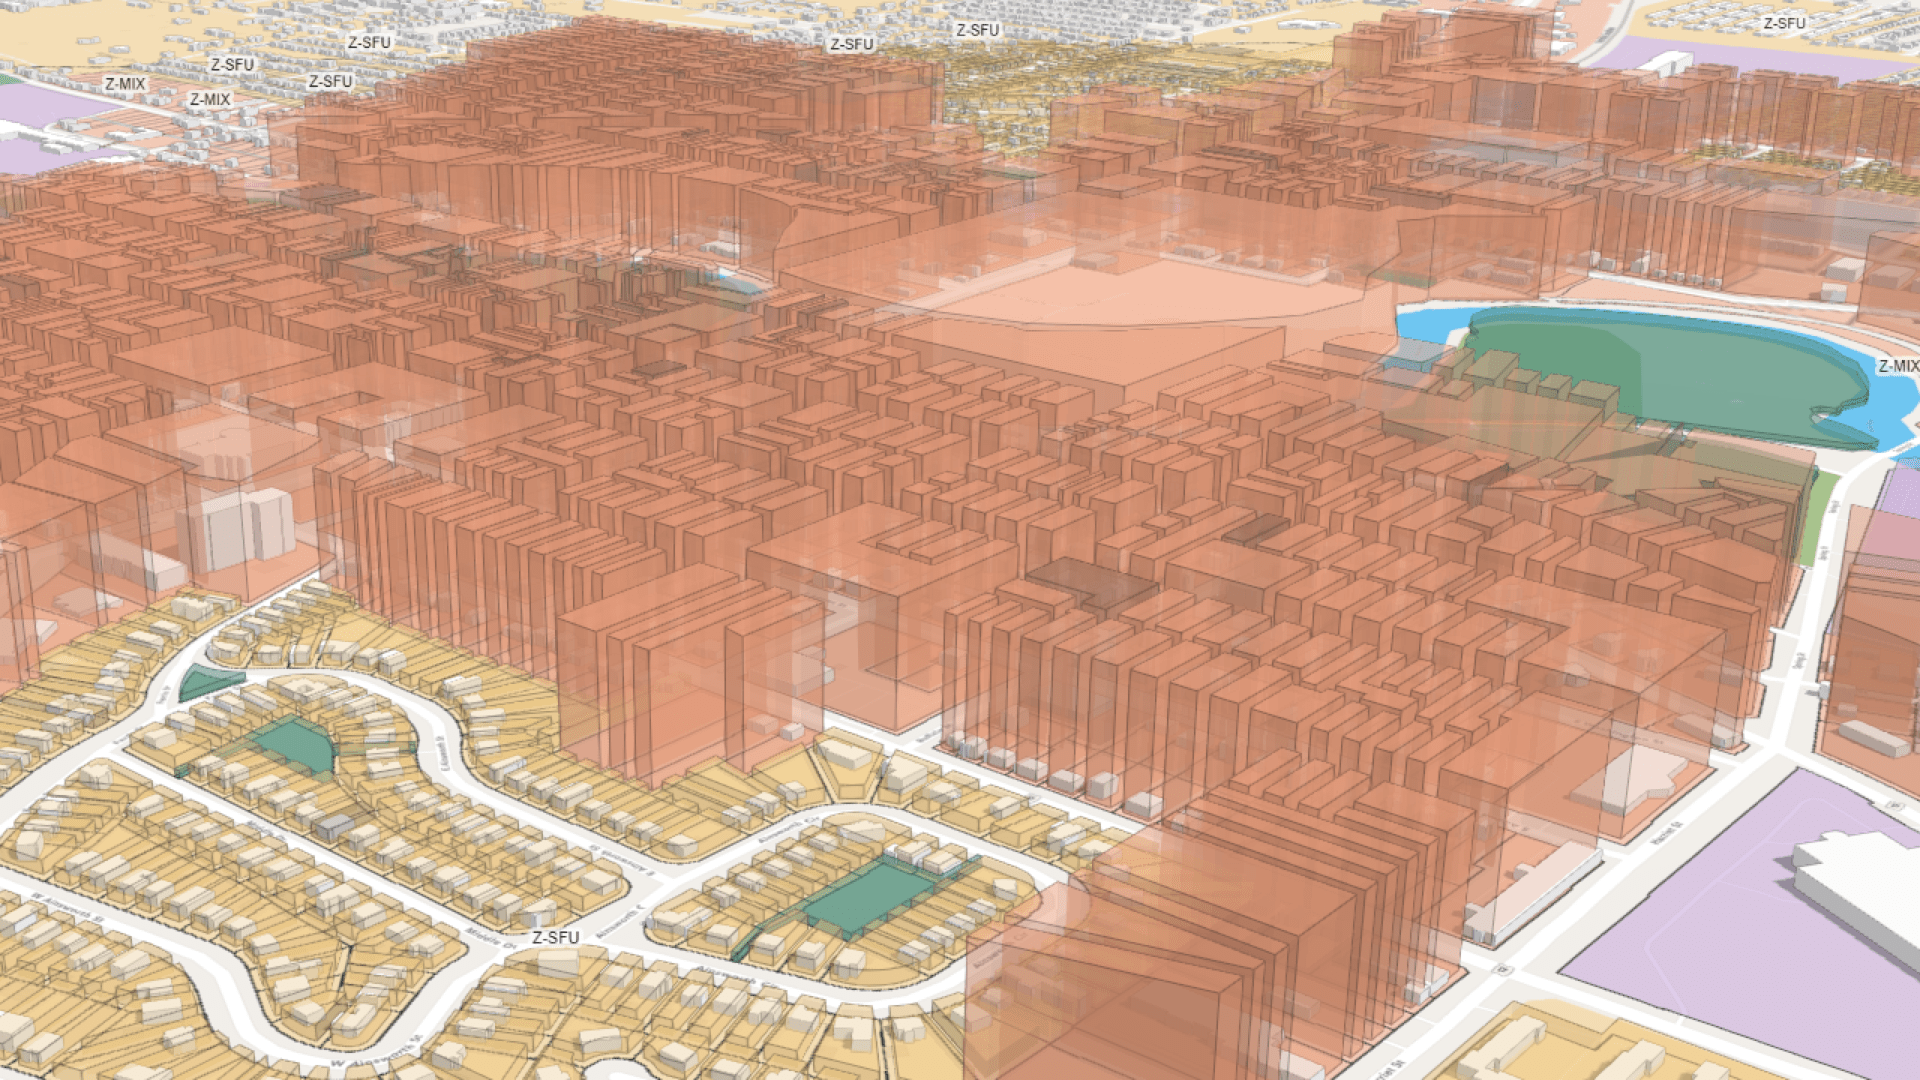
However, residents can be concerned about rezoning. Community members want to know what the city means when it encourages mixed-use development. For example, color-coded 3D GIS maps helped the residents visualize proposed changes by displaying how the neighborhood looks now and how it will look in the future.
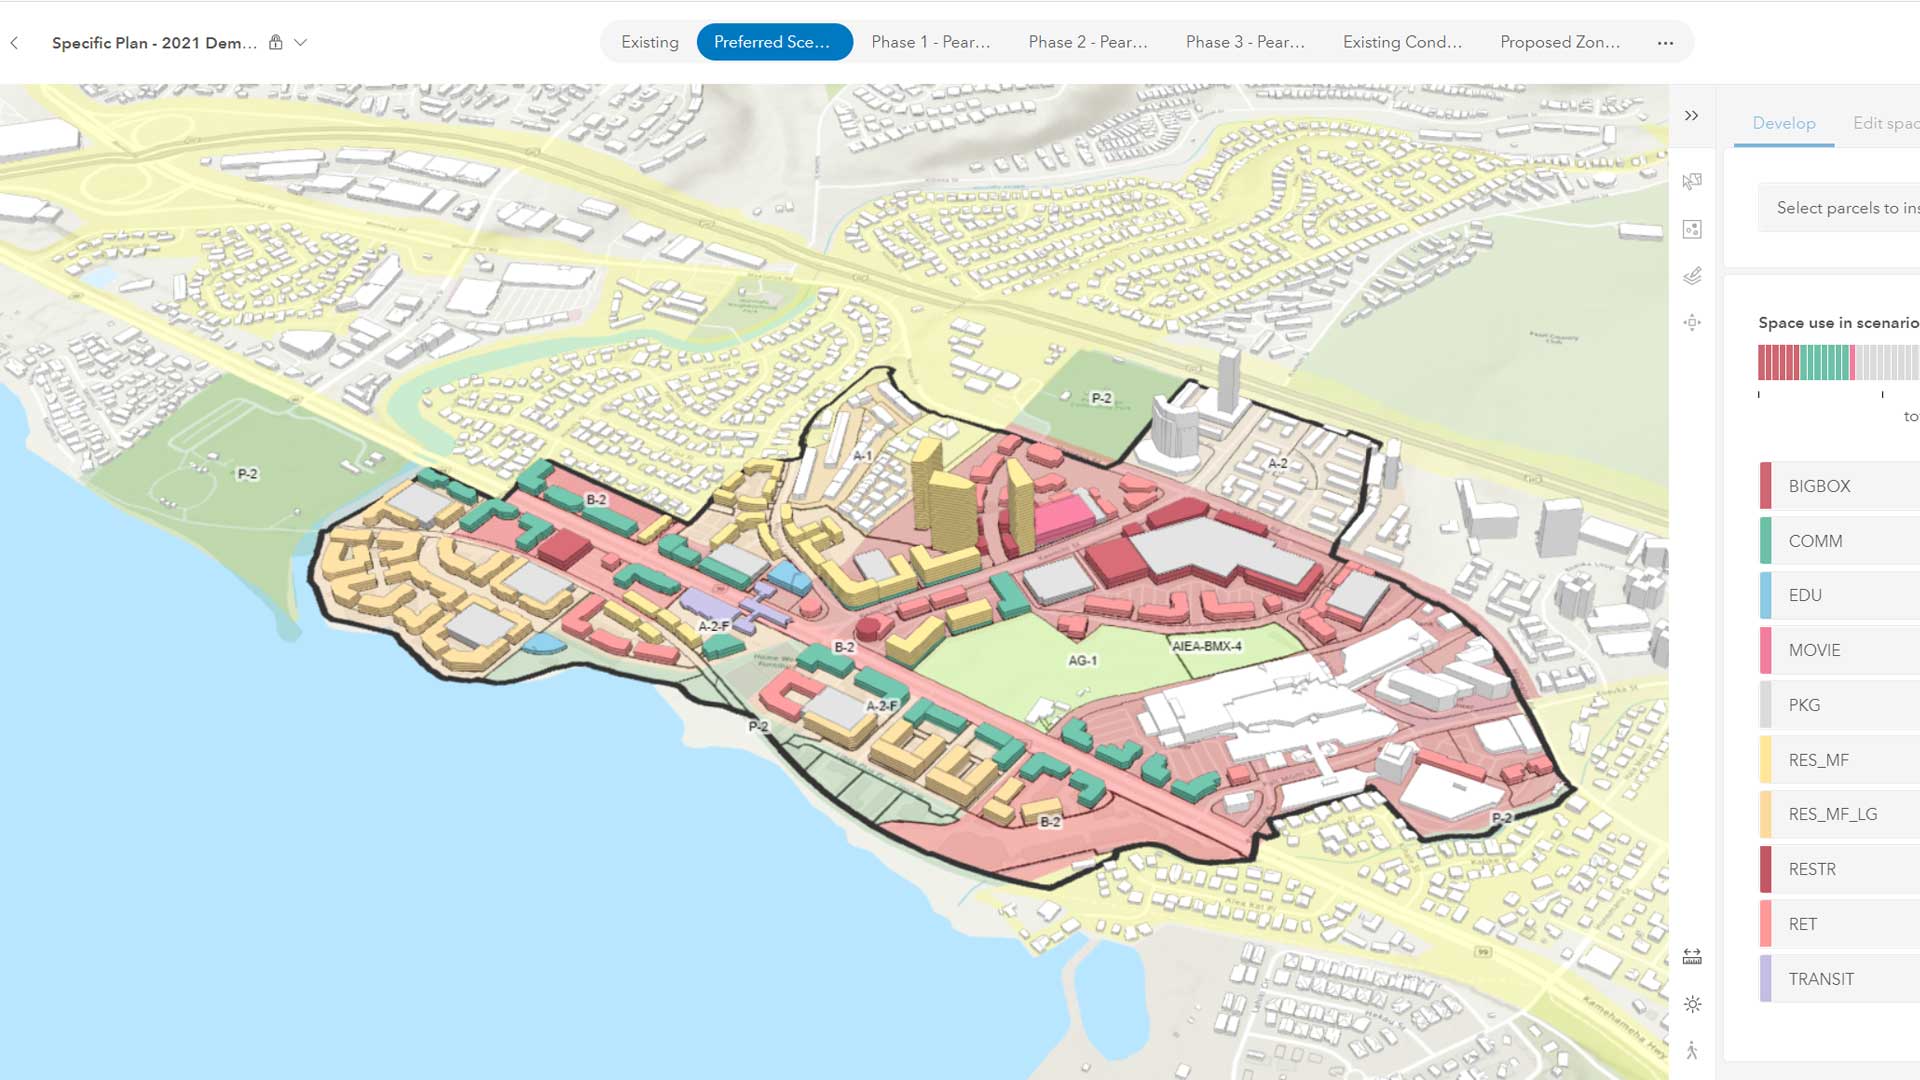
Separately, planners and consultants confer to address issues of unease, modifying a 3D geospatial digital twin of Crossroads. As modifications are made, previous versions are automatically saved to be compared to new ones. This helps planners, consultants, and community members attain a shared vision.
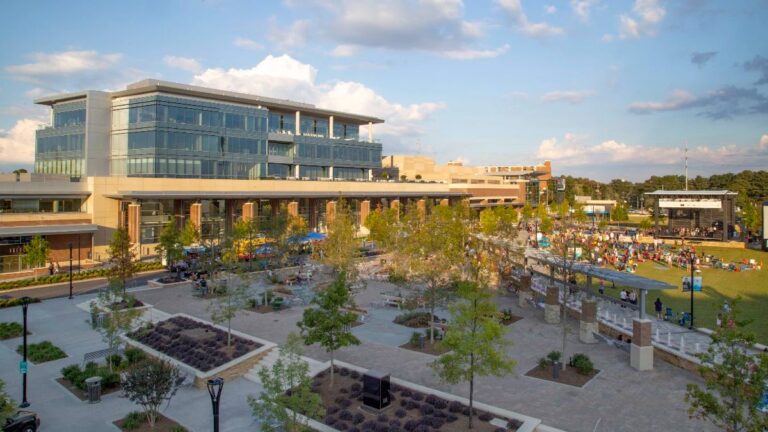
A mile up Route 9, on the other side of I-285, significant changes are coming to the area around City Hall. The City Green refers to a large grassy area in front of City Hall that hosts outdoor concerts in the summer, a “sparkle parade” during the winter holidays, and a farmer’s market on Saturdays during spring and summer.
A block or so away, the city is working with its preferred development partner to refine plans for the area. Some buildings will have street-level retail spaces and apartments on the upper floors. A hotel is also under consideration.
As with Crossroads, some people in the area have expressed worries about altering the neighborhood. Residents who reside in the area’s apartments, for example, were concerned that new buildings might obstruct their view.
“When people hear a term like ‘mixed-use development,’ they can sometimes think ‘oh no, I don’t want that,’” said Bridget Lawlor, GIS manager for the City of Sandy Springs. “But when we can show them that we can make it look attractive and functional, that often helps.”
Realistic GIS models of the plans help skeptics visualize the plans.
“Whenever we were doing the conceptual model for the City Green area, I used ArcGIS CityEngine to add facades to the building, to give a realistic feel of what this will look like,” Lents said. “And we use these things as modes of communication so that other people can see the plans visually intuitively.”
“Including the facades means the buildings don’t just look like Lego bricks,” Lawlor added. “Putting in things like trees, benches, and streetlights makes a world of difference.”
By angling the perspective, the models can even reveal whether viewsheds are blocked.
Other GIS tools simulate the likely effects development will have on the city. “With the out-of-the-box metrics ArcGIS Urban comes with, we can look at population changes, jobs added, potential power usage—pretty much anything city management and the City Council might be interested in,” Lawlor said.
In addition to Crossroads and City Green, departments across the city use GIS technology as a guide, a visualizer, and a communications tool.
On the north side of town, developers are overhauling an old strip mall. “We like it when they send us plans that we can just pull into CityEngine, look at what’s there, and overlay the new development,” Lents said. “So, if they wanted to propose something and show it to the public, the public has a way to see what it could be versus what it is now.”
Cycling and walking have become more common ways to get around town, so the city is working to add miles of connected paths, trails, and boardwalks. As the work progresses, Lawlor’s team makes changes to GIS maps.
“Ever since the city became its own entity, there’s been a lot more interest in families being able to walk places,” Lawlor said. “It just shows how generations have changed.”
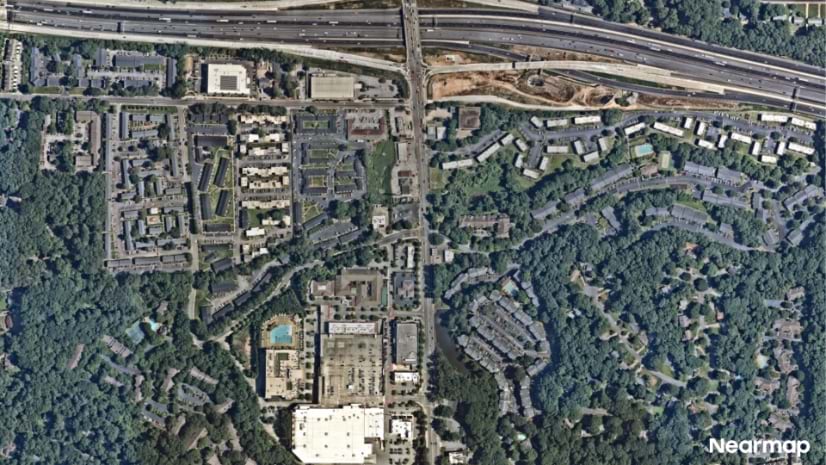
Amid all the changes, GIS helps city leaders ensure the town doesn’t lose desirable aspects of its past, such as green space. Lawlor has recently used GIS and artificial intelligence (AI) derived tree canopy analysis from Nearmap. “We compared our traditional method with the AI, and we found that AI was much more accurate,” Lawlor said. “Moving forward, we’re just using AI.”
Much of the city’s tree canopy loss, she’s discovered, is occurring near where I-285 is being widened. A half-century later, the expressway that pulled Sandy Springs into Atlanta’s orbit is still shaping the city. But now, city planners have the tools to observe how and where such changes impact residents.
Learn more about how GIS is used for smart community planning.

