
July 2, 2024 |
Olivier Cottray | Public Safety
March 25, 2025
In his work at HumAngle Media, Mansir Muhammed documents Nigeria’s invisible war.
Through powerful imagery, open data, and geographic information system (GIS) technology, he maps the human cost of conflict that has ravaged his homeland for decades.
The statistics tell only part of the story: over two million people have been displaced, and tens of thousands killed across the Lake Chad region since Boko Haram began its reign of terror 16 years ago. While the world briefly took notice after the 2014 kidnapping of the Chibok schoolgirls, the group’s brutal campaign—murdering men and enslaving women and girls—continues largely unnoticed by the global community.
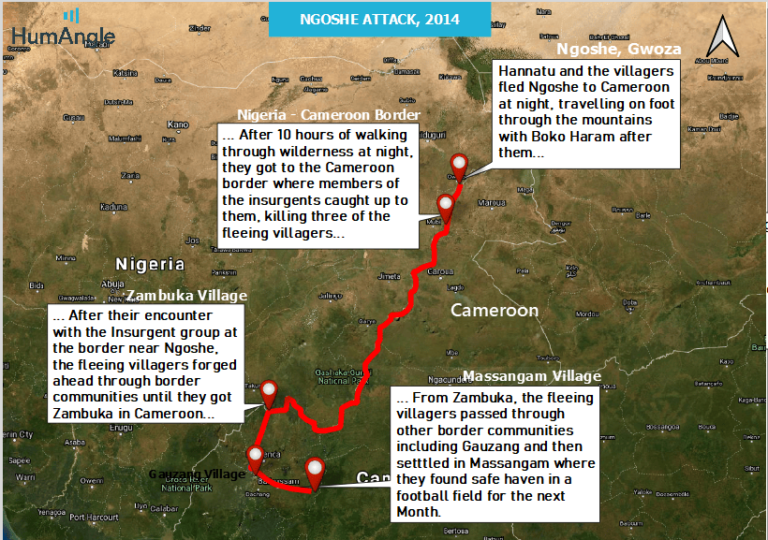
Muhammed told the story of one of these women, Madam Hannatu, mapping out her personal account of escaping a violent attack. He took care to map the treacherous terrain, the hazardous thickets, and the venomous snakes. “I was so close to it,” Muhammed said. “It was as if I was there following her through the bushes.”
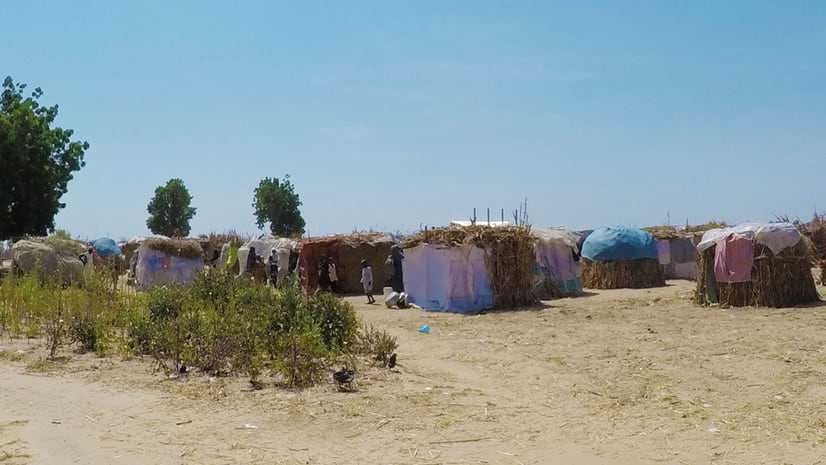
Madam Hannatu fled along with other women and children after militants killed 30 people while they slept and set fire to the huts in her home village of Ngoshe. She trekked for more than 10 hours through the night with her three-year-old son on her back while holding the hands of her 12-year-old daughter and 10-year-old niece. One woman was shot as she knelt to nurse her baby. Hannatu and others in her group managed to cross the border into Cameroon and locate a refugee camp.
“Being able to visualize it helped us show what it was like for her—the fear they felt before finding safe haven,” Muhammed said.
At HumAngle, Muhammed is the newsroom specialist in GIS and open source intelligence. He studied geography and environmental resource planning at the University of Abuja in Nigeria before working as a journalist and accepting his current role. Along the way, he discovered GIS as a critical tool, supporting his work to visualize and analyze human suffering, so the stories will not go untold.
After nearly five years with HumAngle, Muhammed’s mapping work has told the stories of villages wiped off the map, wrongful detentions, and mass graves—depicting the human price of conflict. The maps convey the geographic vulnerabilities of an interstate region with hills and forests that allow armed groups to advance and retreat unchecked.
“We’re in an age where information is so fast, and there’s so much pain out there,” Muhammed said. “Sometimes people just want you to show them before you tell them or show them instead of telling them.”
Muhammed’s first map for HumAngle displayed the number of people infected by COVID-19. He soon established his own byline for map-based stories guided by spatial analytics that mark trends and relay human conditions.
He accesses open data—including such details as population, poverty, land cover, climate, crop production, and satellite imagery—from the Africa GeoPortal [see sidebar]. He uses the site to connect with other Africans and learn about the data and tools he can exploit for investigative purposes.
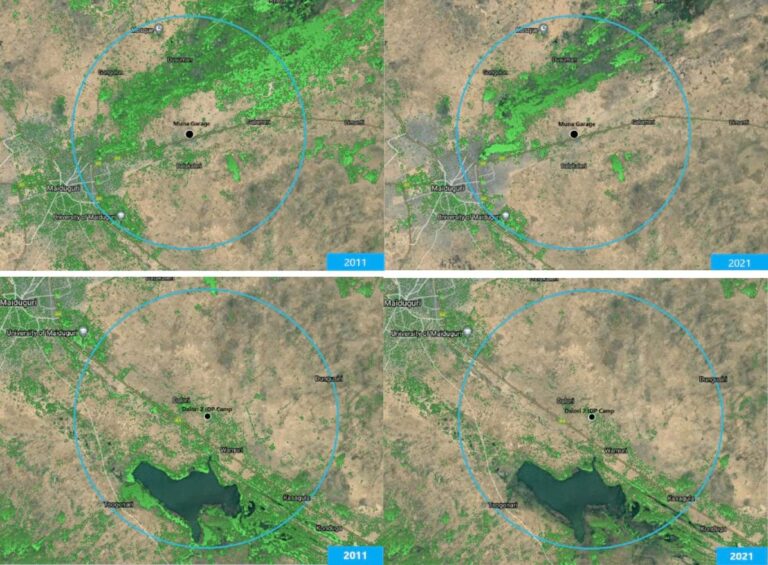
An analysis of satellite imagery he conducted in May 2023 revealed more than 200 towns, hamlets, and villages in Nigeria’s Borno State that the insurgents destroyed. His subsequent story, “No Way Home: Satellite Images Reveal Dozens Of Towns Destroyed by the Boko Haram Conflict,” visualizes the land before and after the insurgency. Imagery comparisons reveal the dwindling number of structures, the decay of roads and tracks overgrown by brush, and the lack of boats on the waterways.

In contrast to the return of nature without human presence, his maps of internally displaced person (IDP) camps reveal how desperate people confined to a small place and robbed of their livelihoods have decimated the trees.
“Poverty led to mass deforestation,” Muhammed said. “Visualization gave us a way to convey the pressures of people by showing the growing impact of wood harvesting around the camps.”
The harms of the insurgents and the government’s military response are difficult to comprehend. Civilians face attacks from both groups. To lend greater understanding, Muhammed created databases that bring together details about the people who live in the camps and the hardships they face.
“In a lot of these places, you can’t even envision the process of recovery yet because these places are still contested,” Muhammed said. “When they seem dormant that doesn’t mean those places are safe. We’ve reported mass kidnappings and IED [improvised explosive device] attacks around areas the government is working to resettle.”
Muhammed has also reported on flooding, drought, and other climate pressures that add to food insecurity in the region. People in IDP camps are among the most vulnerable to these hardships.
Rising threats of flooding during the rainy season add to pressures on agriculture and livestock. In 2022, flooding killed more than 600 people in Nigeria, and more than three million more were adversely affected by it.
A growing number of hotter days from March to May leave little refuge for the region’s urban poor people who often lack the shade of trees when northern Nigeria experiences highs above 40°C (120° Fahrenheit).
“The central part of the human element of our reporting—what we write about and map—is about where the people are and why they are in these camps,” Muhammed said. “People have been resettled in places that are still dangerous and often they are displaced all over again by violent storms or violence.”
Through spatial analysis, Muhammed exposes corrupt officials, turning data into evidence that brings accountability. His investigative maps reveal critical failures, tracking delayed maintenance and responses to violent attacks that cost lives.
When a dam near Lake Alau in Borno State failed, Muhammed mapped the destruction. His story details how flooding buried thousands of homes in the capital city of Maiduguri, displaced more than 400,000 people, and killed more than 150 people.
His reporting used satellite images to display the lack of dam repairs, despite government funds allocated for that purpose.
“It’s one of our top stories because people could relate to it and could visualize it,” he said. “A lot of people were sharing it, trying to get others to talk about it and demand accountability.”
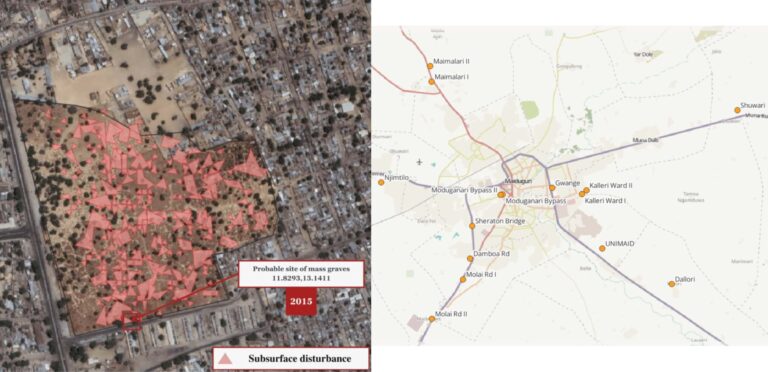
The government has also been implicated in the plight of more than 25,000 people reported missing in Nigeria. The Nigerian army arrested and detained thousands of civilians in the northern city of Maiduguri from 2012 to 2015. Few people were released, and families still struggle to know whether their loved ones are still alive.
Muhammed used synthetic aperture radar (SAR) to reveal changes in the soil combined with archival satellite imagery, witness statements, and press reports to investigate what happened. His evidence uncovered a campaign of executions, extrajudicial killings, and mass burial sites obscured for more than a decade. Through analysis techniques, estimates could be made on the number of graves dug and the number of bodies seen in satellite images.
This investigative work won Muhammed a prestigious Sigma 2024 data journalism award.
“It was a great honor to win the award,” he said. “After some years of trying to pioneer a unique method of storytelling, it was great for us to see such recognition, especially for such an important story.”
Journalists from around the world have reached out to him for tips and ideas on how to use GIS for investigative work. He has since collaborated with other outlets on stories that apply the analytical power of GIS, and he has held weekly training sessions to equip HumAngle’s reporters with GIS skills for their own investigative work.
“We exist to tell the human story,” Muhammed said. “GIS isn’t just a tool. It’s about making the invisible visible.”
Read more about how GIS guides humanitarian assistance.