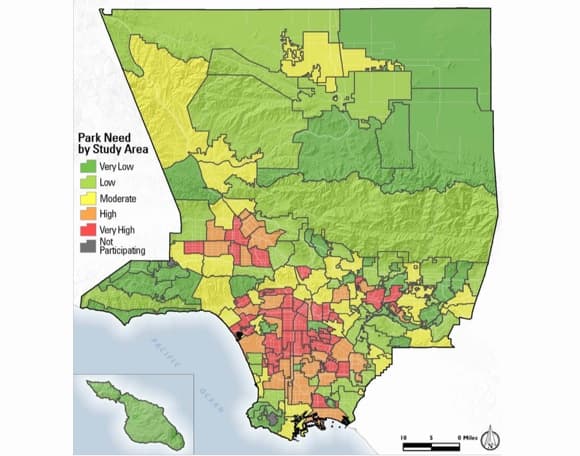

GIS [geographic information system technology] and mapping were central to the assessment effort.
September 5, 2017

The Second in a Three-Part Series on the Use of GIS to Promote Greater Access to Parks
The Los Angeles County Regional Park and Open Space District has primarily been funded by two benefit assessments, which generated approximately $80 million annually. The 1992 assessment expired in 2015, and the 1996 assessment will end in 2019, leading to an urgent need for funding to provide safe, well-maintained parks for the growing population of Los Angeles County. Given the shrinking timeline, the Los Angeles County Board of Supervisors placed Proposition P—a hastily framed park funding measure—on the ballot in 2014.
Many groups, including the influential Los Angeles Times, opposed the measure because it left many issues unanswered. With little outreach and much opposition, the measure failed.
“The measure failed partly because it wasn’t based on how much money was needed,” says Mary Creasman, California director of government affairs, with the Trust for Public Land (TPL). “It was put on the November ballot in August, so there wasn’t time to engage the public and build support.”
With growing urgency, the county responded to the criticism and went back to the drawing board.

Power of parks
Parks provide a place for play, picnics, public events, socializing, exercise, sports, contemplation, relaxation, and connection to nature. While many see the green space of parks as a luxury, recent research correlates parks with more livable cities and better public health.
Parks improve cities as
Parks improve lives as
Los Angeles County officials needed to convey these benefits to voters. However, they also needed to assess and understand the current state of their parklands to determine what was missing or needed improvement. This time around, officials stepped back and commissioned an in-depth review of the county’s parks with the Countywide Comprehensive Parks and Recreation Needs Assessment.

GIS [geographic information system technology] and mapping were central to the assessment effort.
Assessing needs
There was no record of all the county’s parks, and it was a daunting task to pull the data together. Los Angeles County is the most populous in the nation and one of the largest, with 10 million residents across 88 cities, numerous unincorporated communities, and an area of more than 4,751 square miles. There are 3,024 parks that cover 900,000 acres; however, most of the acreage is currently in mountain parks, and urban centers are left lacking.
The county was divided into 188 study areas based on jurisdictional boundaries and equality of population size, and officials sought feedback from cities, unincorporated communities, community-based organizations, and other stakeholders.
“GIS [geographic information system technology] and mapping were central to the assessment effort,” says Clement Lau, AICP, departmental facilities planner with the Los Angeles County Department of Parks and Recreation. “The first step was creating and providing a portal where each city could enter details about its parks—the location and size of each park as well as the amenities, facilities, and their condition.”
Planners developed a model to analyze access to parks or open space, using five key questions for each study area:
Next, for each park, planners compiled an inventory of 16 common amenities, including baseball fields, basketball courts, community/recreation centers, dog parks, fitness zones, gymnasiums, multipurpose fields, picnic shelters, playgrounds, restrooms, senior centers, skate parks, soccer fields, swimming pools, and tennis courts.
Analysts then assessed each amenity at each park and categorized the amenities by quantity and condition. Using this comprehensive inventory, the analysts identified the needs and estimated the cost, both for proper maintenance and for the funds required to add amenities to parks that were missing key elements.
The bottom line—$21 billion was needed across the county for its parks.

Deficits defined
A technical advisory committee reviewed the method behind the maps created for the massive parks review, with 12 experts weighing in on the approaches to data capture, analysis, and results.
“It was an iterative process,” says Robert Mazur, GIS manager for Northern California for PlaceWorks, the consulting firm that generated the maps. “We presented methodology and procedures and then tweaked that based on feedback.”
The ArcGIS Network Analyst tool from Esri was used to assess park access, determining precisely how long it takes residents to walk to each park. Each park was mapped to determine its reach (including multiple access points), its size, and the population of the surrounding area.
“When we first ran the model, a couple of wealthy cities came out as high need,” says Lau. “What happened was, population density weighted high, and the results didn’t take into consideration large backyards and swimming pools. We retooled the model, as we didn’t want one outlier making people question the validity of the map or the parks’ needs assessment in its entirety.”
The model and the maps have been well received by each of the 188 study areas, with feedback validating that the tools reflected the actual conditions of the parks.
“The map really did drive the conversation of how to make sure everyone in the county has access to parks and open space, because people could see what access looks like,” says Creasman.
With the deficits defined, Los Angeles County was prepared to reach out to voters. The county could present a clear picture of how new funding would be applied, with areas of high need identified and targeted for improvement.
Read more
To learn more about how GIS can support thriving communities, visit esri.com/smart-communities. The first story in this series illustrates how the Trust for Public Land factors equity into its park planning process. The third story in the series relates the use of maps to gain community consensus to pass a ballot measure to fund parks in perpetuity.
If you would like to explore the Countywide Comprehensive Parks and Recreation Needs Assessment further, visit the Interactive Maps and Data page. To learn more about the process, view the executive summary or download the final report.


