November 19, 2024
Key Bridge: Cross-Agency Collaboration Quickly Reopens Baltimore Shipping Channel

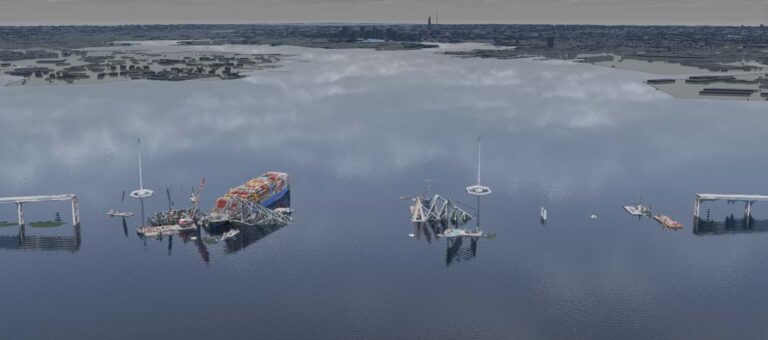
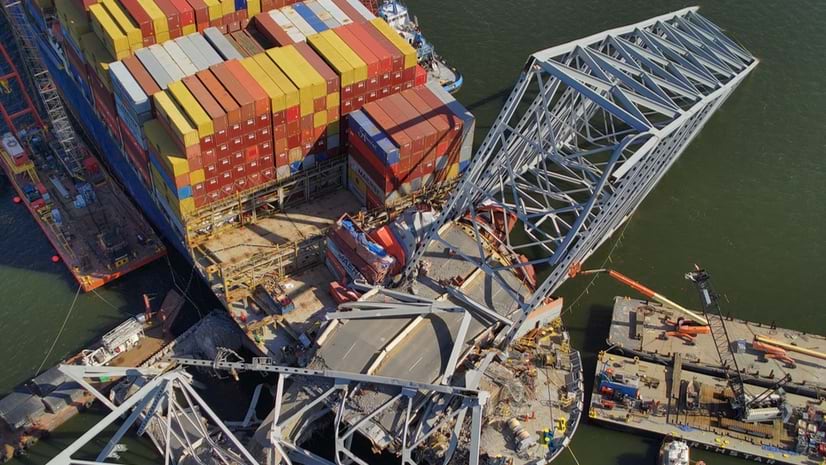
An aerial view of the wreckage before 50,000 tons of debris were removed. (Photo by Alejandro Rivera courtesy of the US Coast Guard) [Editor’s Note: The appearance of US Department of Defense (DoD) visual information does not imply or constitute DoD endorsement.]
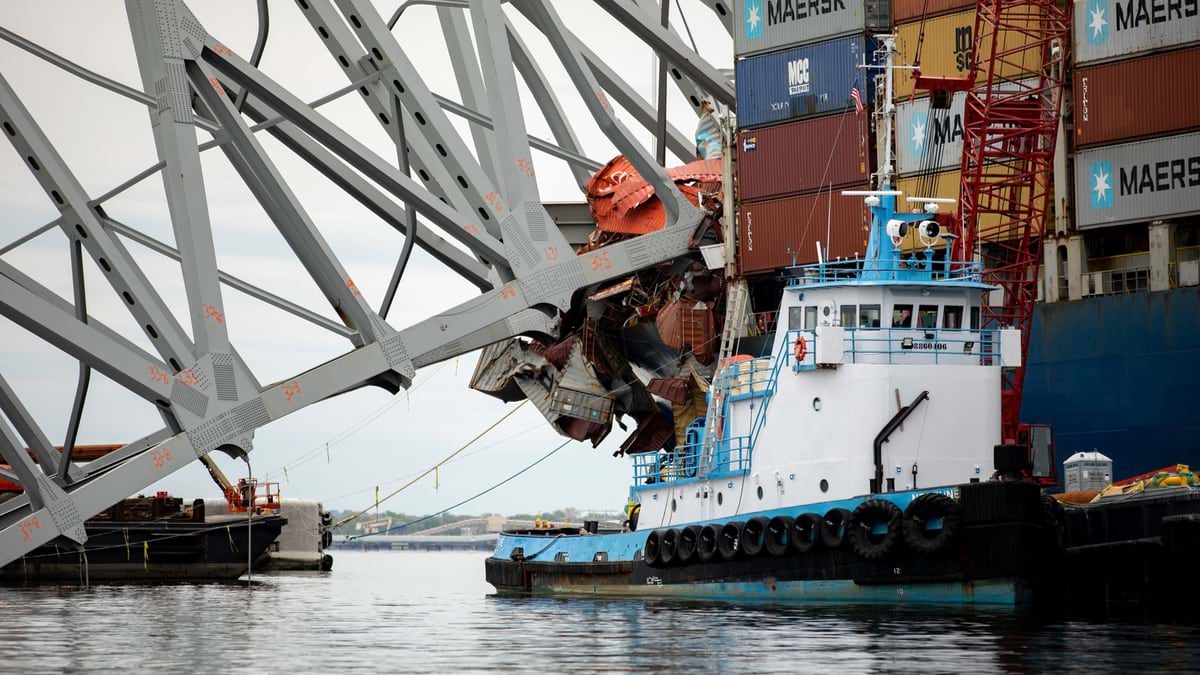
In the early hours of March 26, 2024, the cargo ship Dali crashed into the Francis Scott Key Bridge in Baltimore, Maryland, severing the main span and sending massive steel girders crashing into the Patapsco River. Eight bridge maintenance workers fell into the water and only two survived.
The bridge sits at a vulnerable pinch point—spanning a narrow channel where large ships enter the Port of Baltimore, the ninth-busiest US port. In the days and weeks following the incident that forced a closure of the port, global supply chains and port revenue suffered. The US Department of Labor estimated that 270,000 workers were directly or indirectly impacted. Estimates calculated a daily cost of $192 million in economic activity.
However, the port’s strategic location facilitated a swift response. Proximity to the US capital meant oversight by leaders of federal agencies and the White House. Additionally, being on the busy East Coast meant quick access to necessary equipment and personnel. Responding agencies each connected their enterprise geographic information system (GIS) to the others’ to seamlessly share web maps, web services, 3D scenes, and other data.
Within just six days, a new channel was opened for shallow-draft vessels. By the 30-day mark, half the channel’s width was cleared, allowing deep-draft vessels to pass. In 76 days, the original channel was fully restored.
“By working together, we turned months into weeks—and bounced back faster than many could have ever anticipated,” Governor Wes Moore of Maryland said in a statement.
Supporting Individual Roles for Cross-Agency Collaboration
In the first 24 hours of the bridge collision and collapse, first responders focused on a search and rescue mission. Then, the US Coast Guard, which oversees waterways and bridges that span navigation routes, took the lead. Its Marine Transportation System Recovery Unit started working to reopen the Port of Baltimore as quickly as possible.
“At the start, we pulled together bridge blueprints from the 1970s. By the third day, we built a GIS dashboard to focus on creating new channels,” said Lt. Commander Ian Hanna, lead of the Coast Guard’s Response GIS Support Team. “We knew it was going to be a while for the main channel to reopen.”
The Coast Guard set up a Unified Command Center at the Maryland Cruise Terminal. They added all key data to a real-time GIS dashboard, including vessel locations provided by Esri partner Spire. This dashboard became the center’s common operating picture, with a constant flow of new inputs to keep all stakeholders informed.
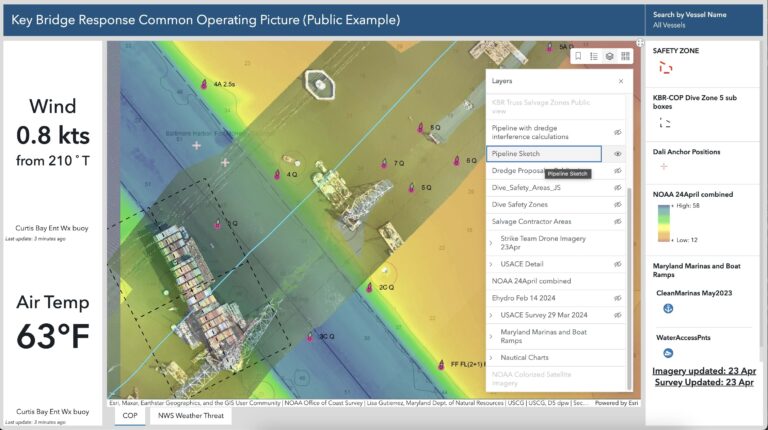
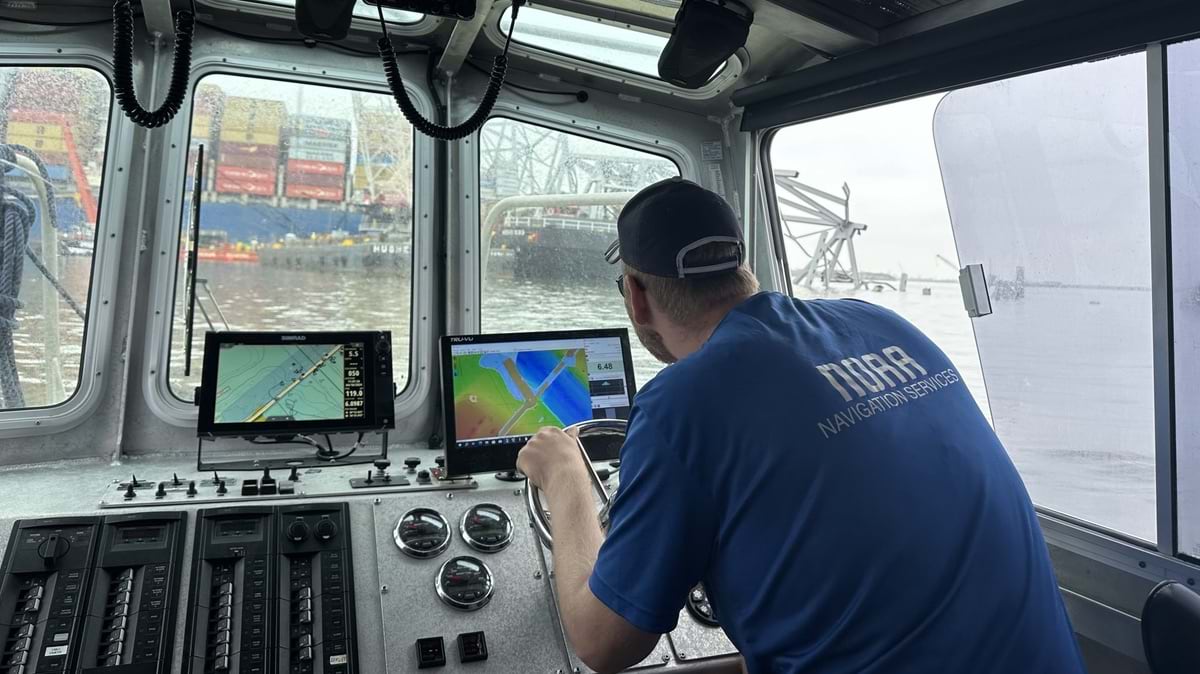
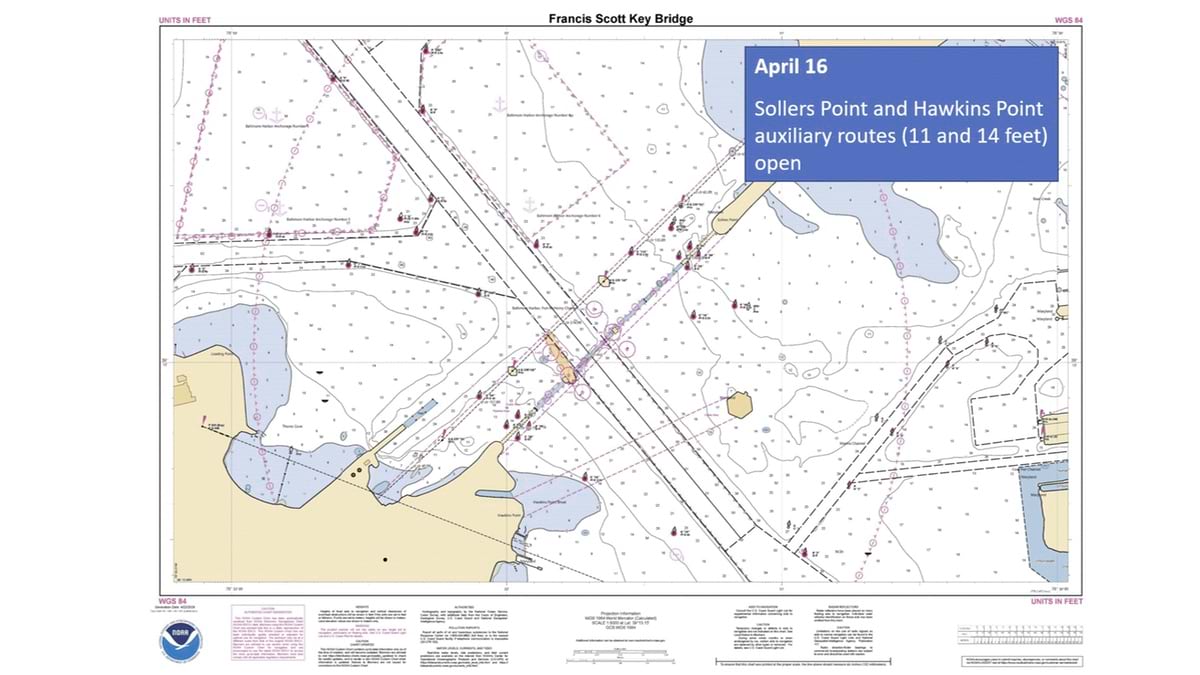
The National Oceanic and Atmospheric Administration (NOAA) incorporated sensor data from buoys, which monitor water currents, and depth data from multibeam sonar surveys to update nautical charts.
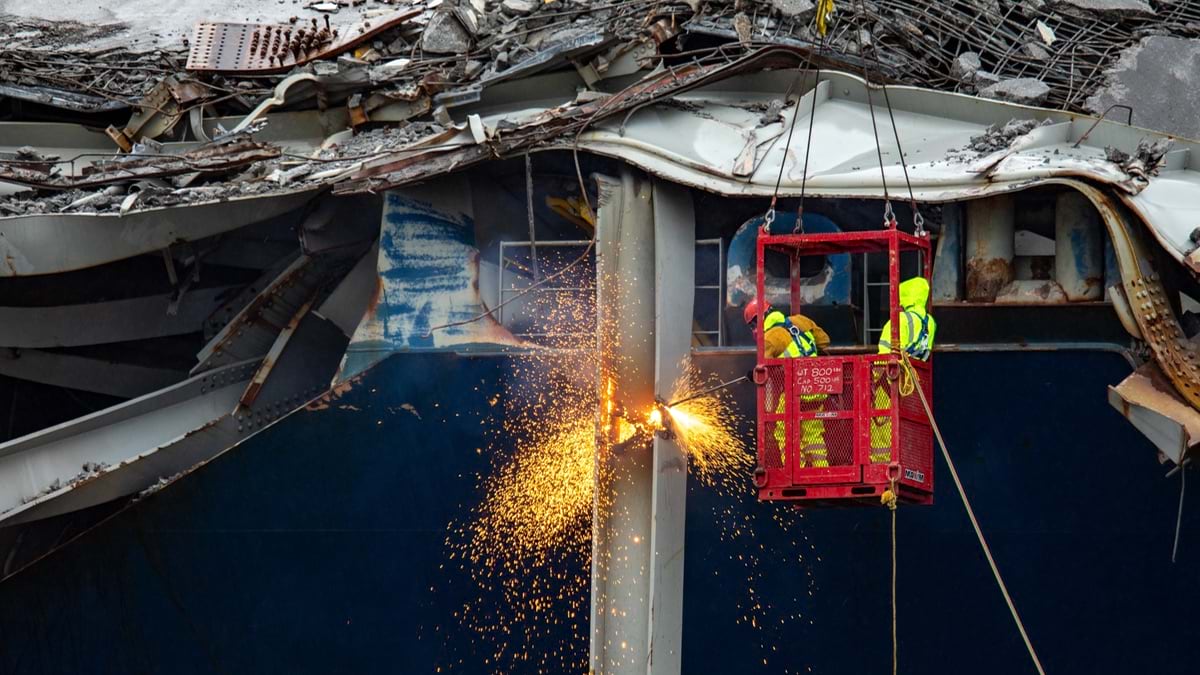
The US Army Corps of Engineers (USACE) added bathymetric channel surveys to monitor changes as pieces of the bridge were removed.
Personnel and data from the Maryland Transportation Authority, the City of Baltimore, and other state agencies joined the effort.
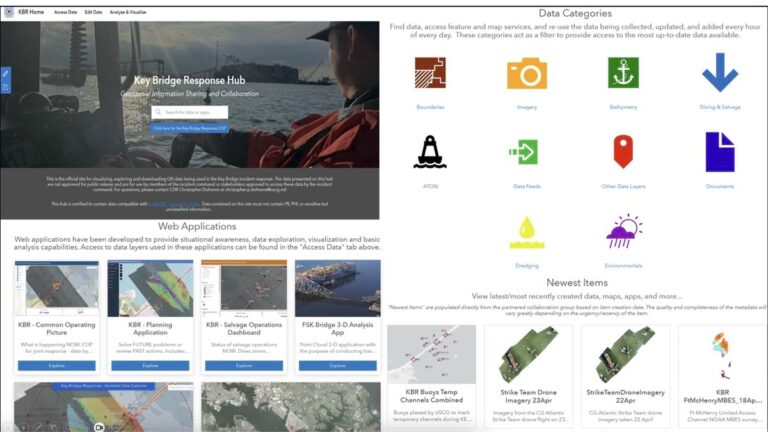
Soon, the individual agencies wanted to create their own purpose-built apps to coordinate missions and feed updates into the common operating picture. Amilynn Adams, a marine transportation system specialist with the Coast Guard, built a site with ArcGIS Hub to connect vital data and share the purpose-built apps from each agency.
“The first 72 hours, everybody was sending me data over email,” Hanna said. “I was spending all night processing that and then posting it onto the dashboard. It was not sustainable.”
“We set up a call with the Army Corps, NOAA, and others on how we wanted to share data,” Adams said. “We created a partnered collaboration group, with restricted access. We were all seasoned on data sharing details surrounding natural disasters and what that means in terms of data governance.”
With portal-to-portal GIS connections, each agency maintained full control over their authoritative data. Shared GIS data layers included bathymetry, water levels, the temporary channels, and ultimately the cleared main channel. A 3D web scene visualized details of the salvage crews working to free the grounded ship and remove pieces of the bridge (see sidebar).
Administrators provided access to anyone who needed to see the data, from divers doing the salvage work to surveyors mapping the channel and White House officials monitoring the progress.
Keeping the Map Updated
To open the auxiliary channel, NOAA surveyed an area called Sollers Point at the north end of the bridge. The water was deemed deep enough. The Coast Guard designed the auxiliary channel and dropped buoys for vessels to follow.
“That discussion centered around data on ArcGIS Online, because we could display the survey data, where the buoys were going to be, and have everybody look at it and approve it,” Hanna said.
A process like this would typically take months. The Army Corps surveys the channel and dredges if needed. The Coast Guard designs the channel and places buoys in the water. NOAA updates the nautical charts.
“If we’re trying really hard to speed our typical process, we can do it in a couple of weeks,” Hanna said. “In the Key Bridge response, we shortened the whole process to less than 24 hours.”
In this case, salvage crews removed debris, the Army Corps and NOAA surveyed, and everyone could see progress on the same day the survey was taken.
“We had a call every day to discuss the data that was going up, who was able to see it, and the data we expected to come in,” said Jared Scott, GIS program manager in the Baltimore District of the US Army Corps of Engineers. “When someone had a question or tapped me on the shoulder because they had a dataset, we had answers from the portal. I could show them how to use it to make their data visible to whoever needed it.”
NOAA connected its navigation response team to conduct hydrographic surveys. “They make a product, which is traditionally a PDF map, that everyone looks at to see if there are any obstructions,” said Leland Snyder, maritime geographer with NOAA. “The hub site was that on steroids. It brought everyone together very quickly.”
With a constrained channel, a new level of traffic coordination was needed. “We built some tools to manage the schedule, using automatic identification system (AIS) data to highlight where vessels were coming in and out. It allowed the patrol commander to watch the scene,” Hanna said.
An additional auxiliary channel, created in less than 30 days, was designed specifically for sugar barges from the Domino Sugar Refinery, a mainstay in the Port of Baltimore for more than 100 years. The sugar was stacking up and needed to get to market to keep goods flowing and the factory running.
Communicating Progress with an Interested Public
The Key Bridge collapse headlined global news for weeks, with sustained public interest until the debris was gone and the main channel reopened. Press briefings relied on GIS maps and 3D visualizations to convey the changing conditions.
“By the time it was said and done, we had done thousands of media interviews,” said Cynthia Mitchell, public affairs specialist for the US Army Corps of Engineers, Baltimore District. “We relied heavily on maps and visuals to help people understand the complexity. Officials wanted details. Having images and maps helped us build trust very quickly, knowing that the information we had accurately reflected the work.”
Everyone involved recognized the significance of the new pattern of the cross-agency collaboration achieved with GIS.
“People saw what we did, they experienced it,” Hanna said. “They could touch it, poke it, prod it, and were able to see how we made connections.”
“We leveraged a lot of things that came out of working remotely during the COVID pandemic,” Scott said. “The ability to virtually plug in from anywhere worked really well.”
“We created many apps that I feel made an impact,” Snyder said. “One called nowCOAST lets you visualize data we’ve never visualized this way before. It was a great achievement.”
This level of collaboration has attracted attention from other agencies, signaling a need to better coordinate in the wake of other events such as natural disasters. The Federal Emergency Management Agency (FEMA), for instance, could take a similar approach to overseeing storm cleanup after hurricanes.
Those involved in the Key Bridge response stay in regular contact, with data integration that supports day-to-day operations.
“Just the other day, we got a call from the National Data Buoy Center that there was a buoy adrift in the Atlantic Ocean,” Snyder said. “I talked to Ian to connect the person at Coast Guard who will go and retrieve it. We just gave him access to the data, because the trust between our portals is already established.”
“This is the way we should be doing business,” Hanna said. “Instead of exchanging things like memory sticks or email attachments, we can connect. It makes it so much faster and more efficient. Everybody could use the data for their mission and be aware of what was happening.”
Learn more about how GIS is used to prepare, manage, and deliver effective humanitarian assistance.
View these stories that recap the incident from each agency’s perspective:
- US Coast Guard: GIS Collaboration in the Key Bridge Response
- NOAA, Office of Coast Survey: Response to the 2024 Francis Scott Key Bridge Incident
- USACE Responds to Francis Scott Key Bridge Collapse
