February 14, 2023 |
Nick Short | Natural Resources
July 16, 2024
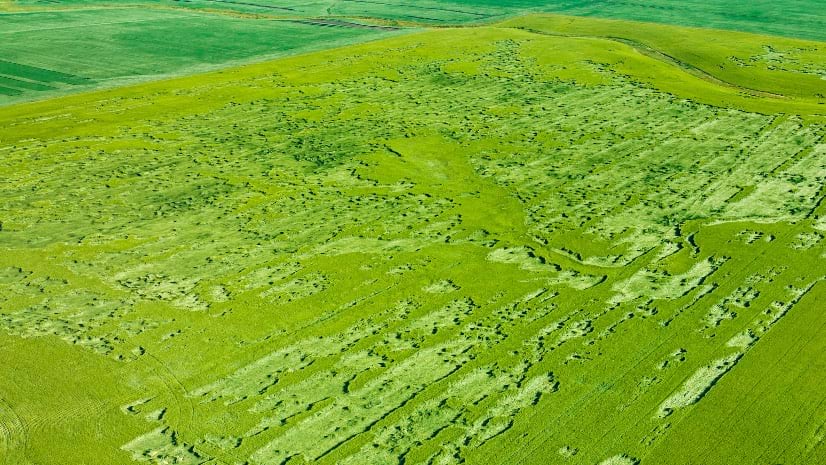
In marginal years when there’s too much rain, not enough, or calamity strikes, US farmers and ranchers rely on insurance from the Federal Crop Insurance Corporation to buffer them from catastrophe. Crop insurance is the largest farm safety net, covering over $207 billion in liability in 2023. Most farmers file justified losses, but occasionally there are fraudulent claims—schemes rooted out by modern crop monitoring. Investigators with the US Department of Agriculture’s (USDA) Risk Management Agency (RMA) use high-resolution aerial imagery to capture field conditions, machine learning algorithms to automate the detection of patterns, and geographic information system (GIS) technology to ground truth claims.
This integration of advanced technologies and data science techniques supports the investigative process that generates positive results—like exposing the Colorado ranchers who were caught tampering with rain gauges, the Kentucky tobacco farmers who were found to have falsely reported hail damage, and the North Carolina farmer who produced crops that were sold in the names of others and reported as lost to natural disasters.
Although it’s only a small number of farmers and ranchers who look for ways to game the system, the financial savings of rejected claims adds up.
“We’ve been able to document a cost avoidance through our Spot Check List program that amounts to more than $1.75 billion over the past 20-plus years,” said Jim Hipple, a physical scientist in the Business Analytics Division of USDA RMA. “Cost avoidance is even better than cost recovery because we haven’t paid anything out, so we don’t have that added burden of trying to pull money back.”
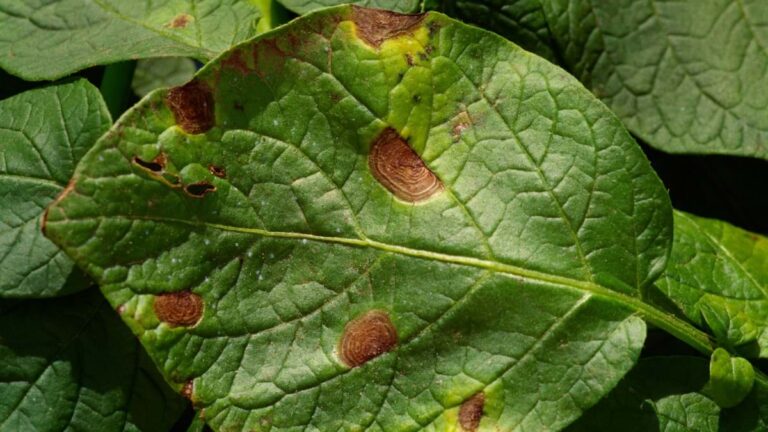
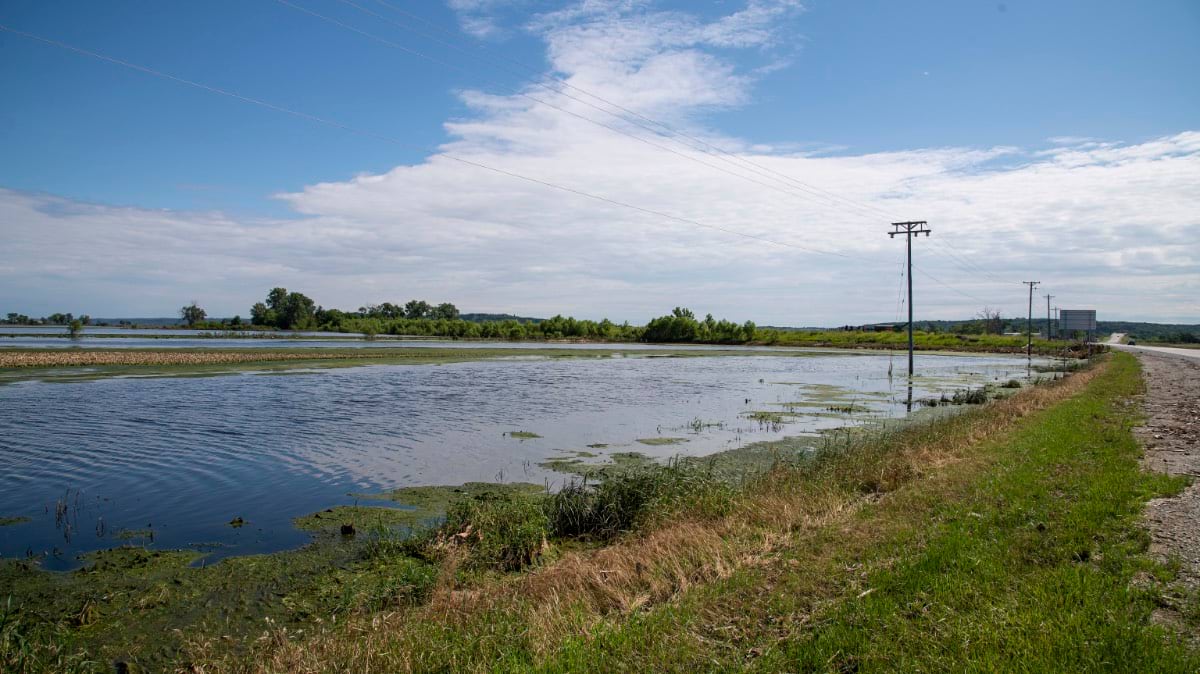
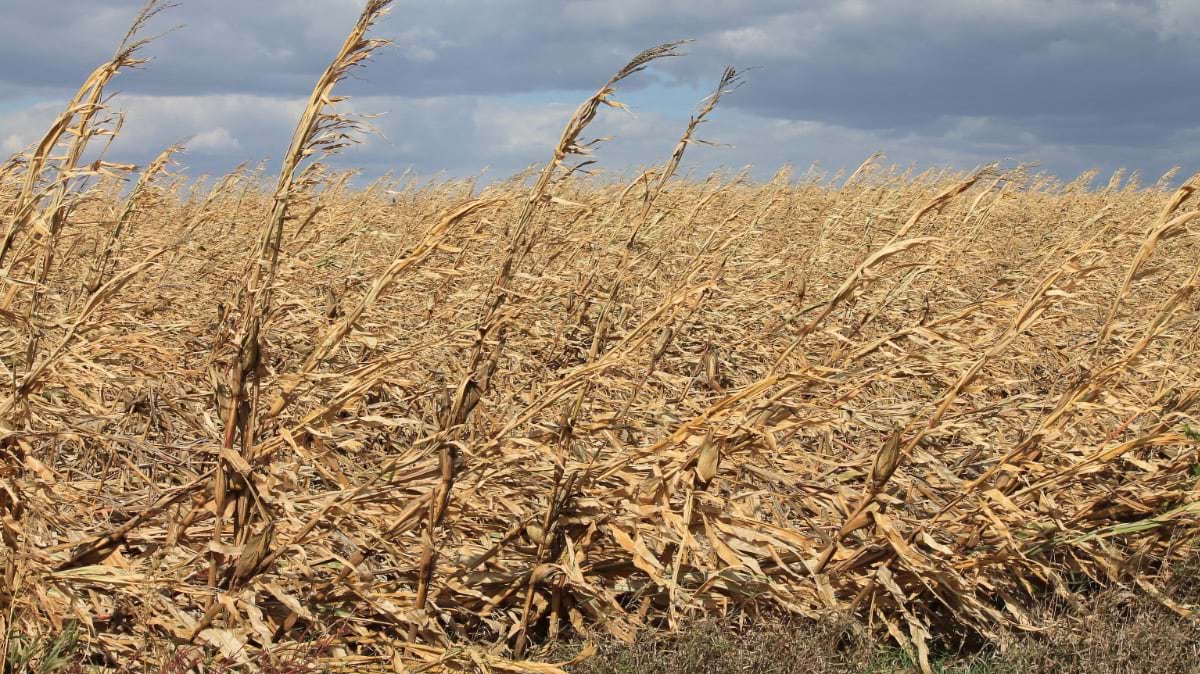
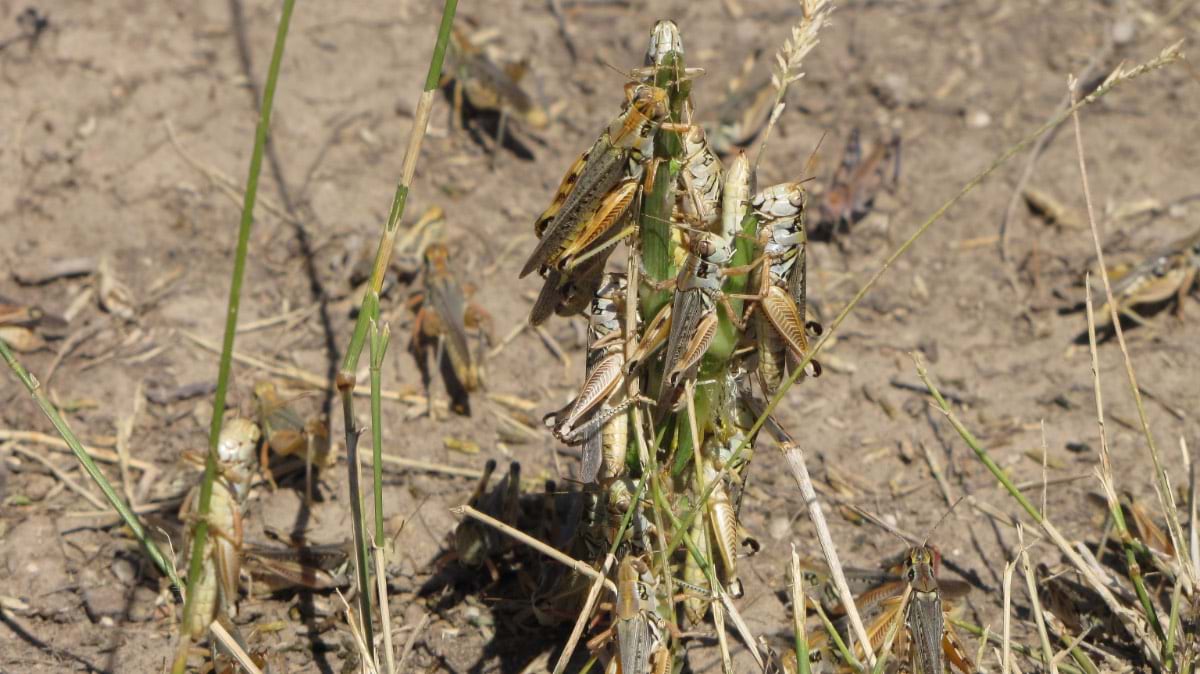
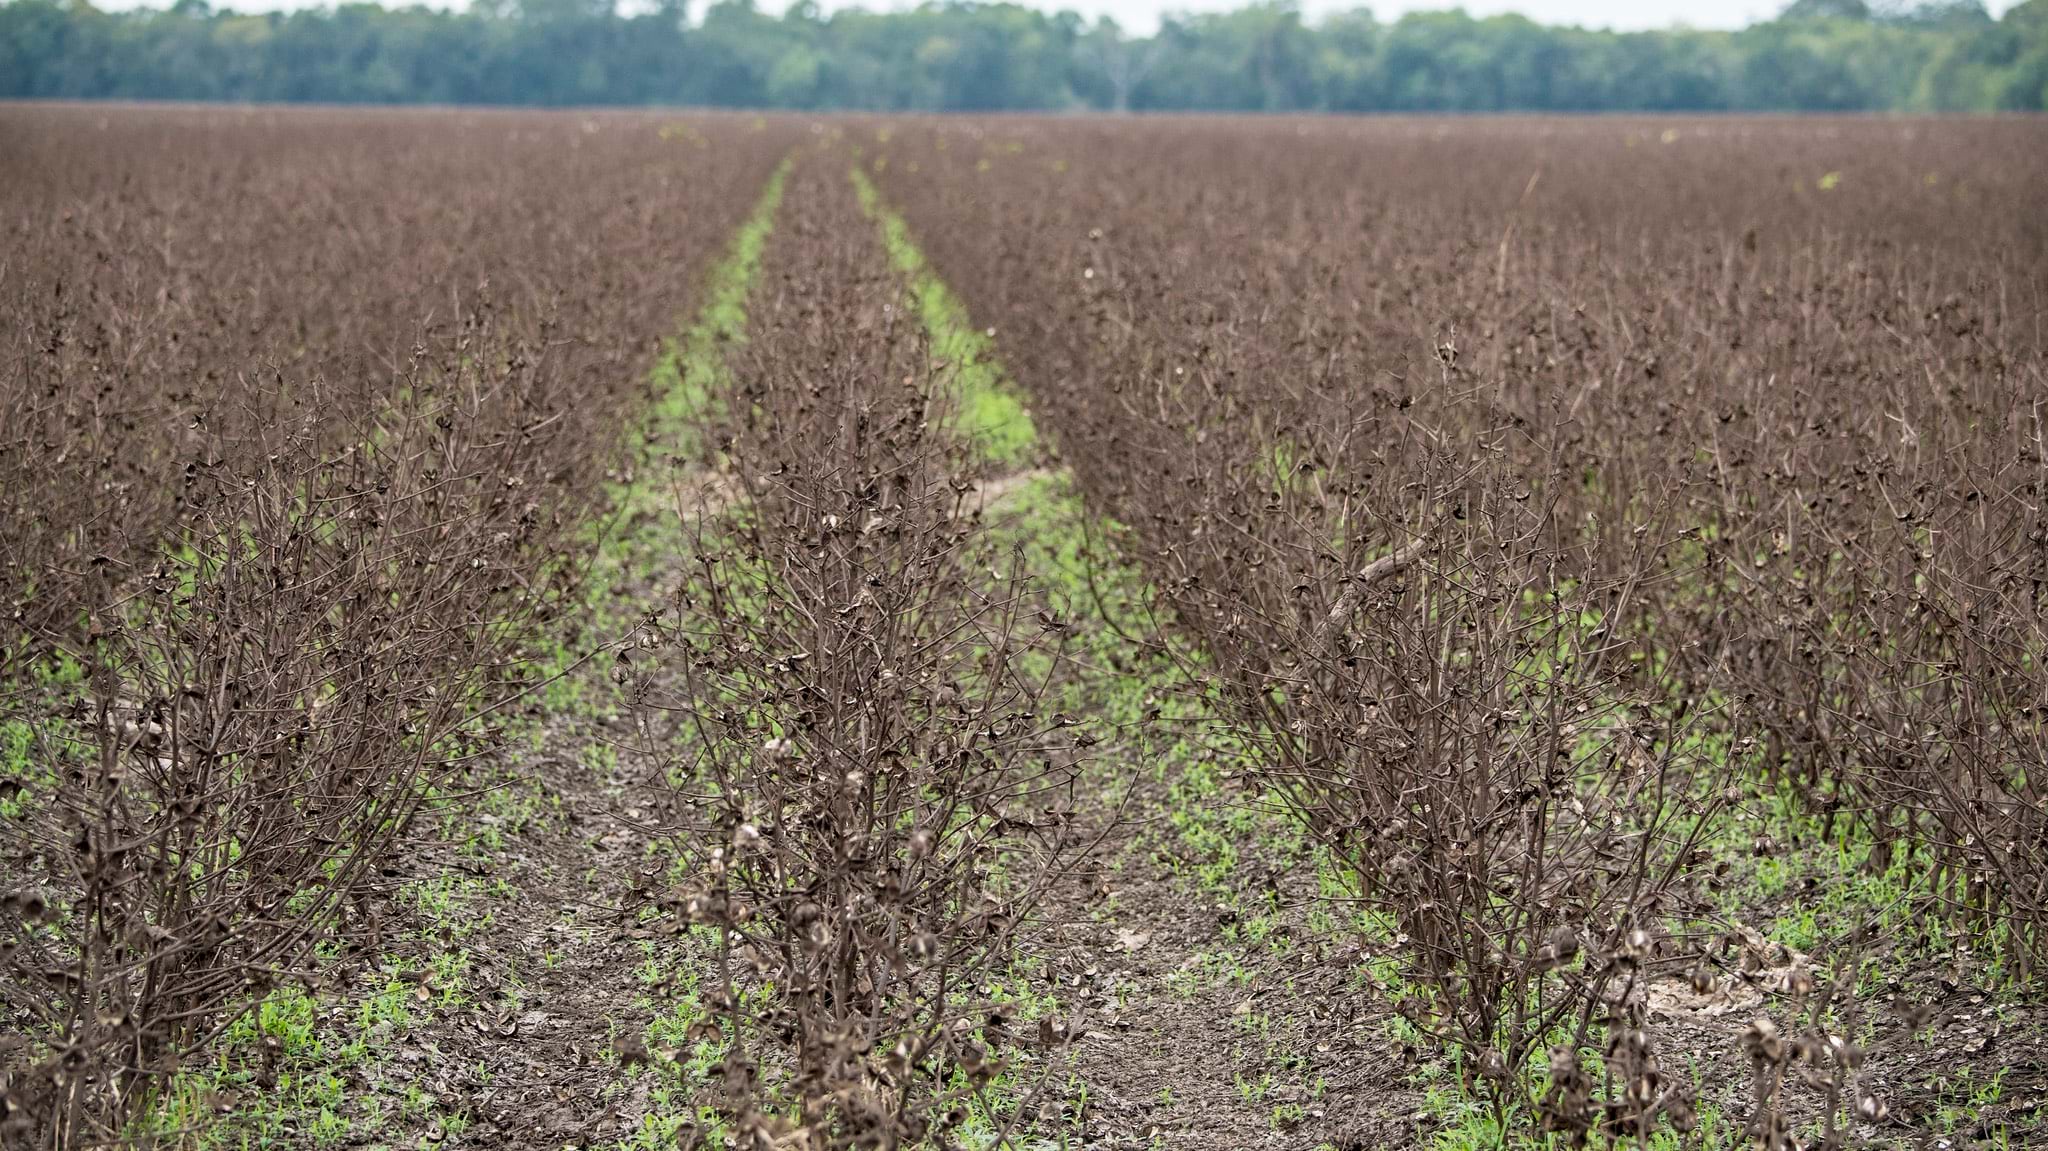
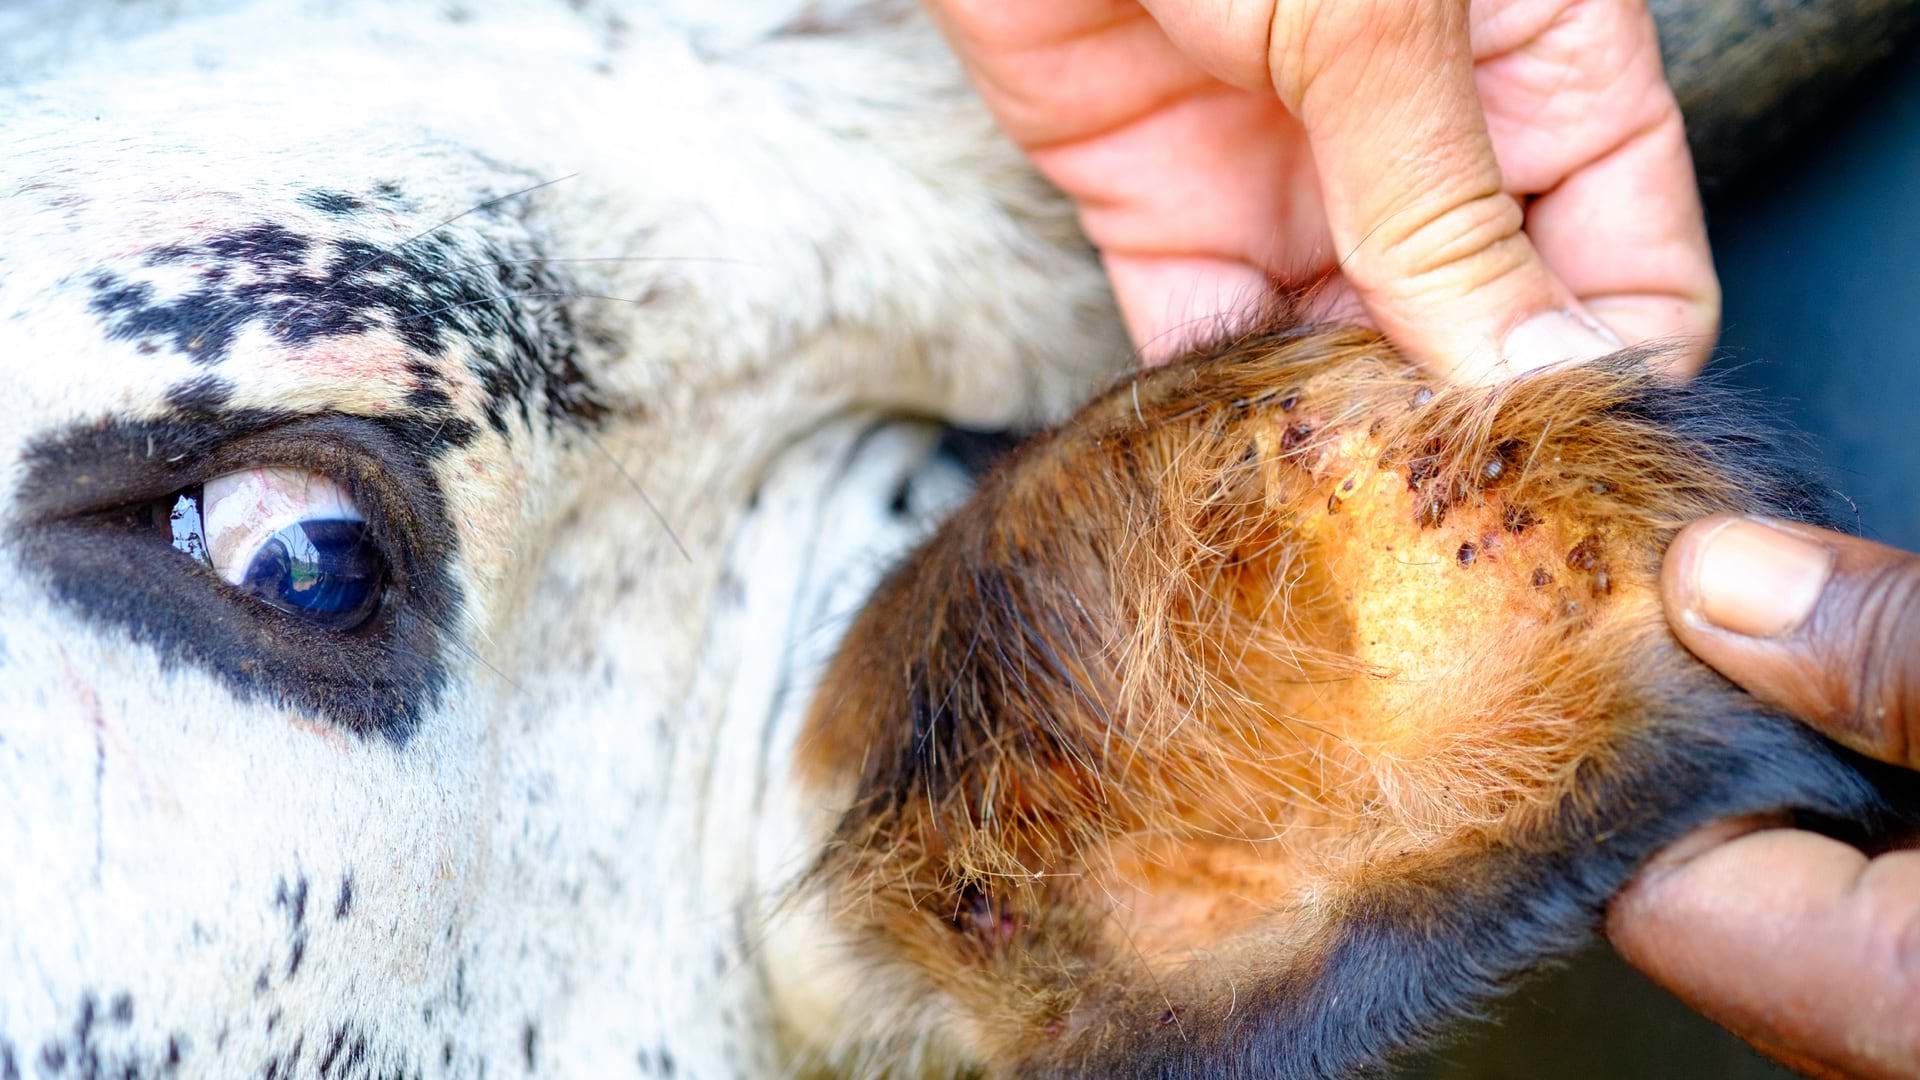
The work by Hipple and others at the Risk Management Agency also helps instill trust in the crop insurance system—an important buffer that protects farmers from major losses due to drought, excessive rain, hail, wind, frost, insects, and disease.
“Crop insurance policies have gotten more specific about the field location,” Hipple said. “That helped us better understand conditions on each farm.”
The USDA’s Farm Service Agency, a sister agency to RMA, mapped the location of every field down to what’s known as a common land unit (CLU). To accomplish this digital transformation, more than 2,500 field service centers across the country were equipped with GIS.
When farmers report their planting intentions through their acreage report at the start of a growing season, the field boundaries are compiled into a database. Over nearly a decade, more than 36 million CLU boundaries were recorded along with land ownership, soil, and crop type.
These digital records can be easily updated and analyzed to visualize agricultural trends, replacing paper maps. Investigators use this field awareness to ask location questions related to claims and speed the processing of insurance payments after disaster strikes.
“CLUs started a really big geospatial shift, but it also meant that we had to have a compute platform that could handle it,” Hipple said.
To handle big data processing at scale, the USDA works with the Center for Agribusiness Excellence at Tarleton State University in Texas. “We leverage the advanced analytics from the university effort to better understand the integrity of a policy, and to seek out waste, fraud, and abuse,” Hipple said.
By adding tabular data to the map, crop insurance compliance investigators can spot patterns and irregularities that indicate potential insurance problems. The key, according to Troy Thorne, director of the Center for Agribusiness Excellence at Tarleton State University, is in identifying inefficiencies—places where the connection between the land and what it produces seems odd or unusual.
Thorne cited the practice of yield switching as an example. Crop insurance operates on the principle of a yield history. If a field has produced the same crop with the same farming practices for three years, insurers average the output to determine an approved yield history. That figure becomes the baseline for insurance claims.
To raise the baseline, a farmer might record the accurate overall yield total for all fields but move the numbers around to inflate one field’s total, thus raising that field’s yield history. When that field produces a normal yield the next year, it will appear to have underperformed, providing the basis for a potential insurance claim.
“Yield switching is a big deal,” Thorne said. “You improve the outcome of your insurance claim without actually suffering the losses.”
The ability to see all related data on a map rather than in a tabular format has helped analysts and investigators find incidents of yield switching and other anomalies.
“As a tabular perspective, it kind of gets lost in the detail,” Thorne said. “But when you add the geospatial layer and drop these things on a map, you can look at historical yields, and see that the farmer’s yields are constantly fluctuating.”
Today, the USDA’s RMA has extended access to GIS insights across its team of 90 compliance investigators. Maps and data allow these investigators to dig into the forensics of farming—including plant time versus harvest time, crop yields, and the impact of moisture.
The biggest leap, according to Thorne, has been in the nuances of their analysis. They can compare each claimant’s farms to those in similar geographies and consider geographic features in assessing claims.
“Your nearest neighbor from a geospatial perspective might be two states away, because that’s where the soil, slope, and climate match,” Thorne said. “One inch of rain on a sloped field versus a flat field makes a big difference. All these itty bitty things that are geospatially related become very important when you’re trying to estimate crop yields or validate crop loss claims.”
Learn more about how insurers apply location intelligence to mitigate risk.