
January 7, 2020 | Greg Milner | Mapping
July 30, 2024
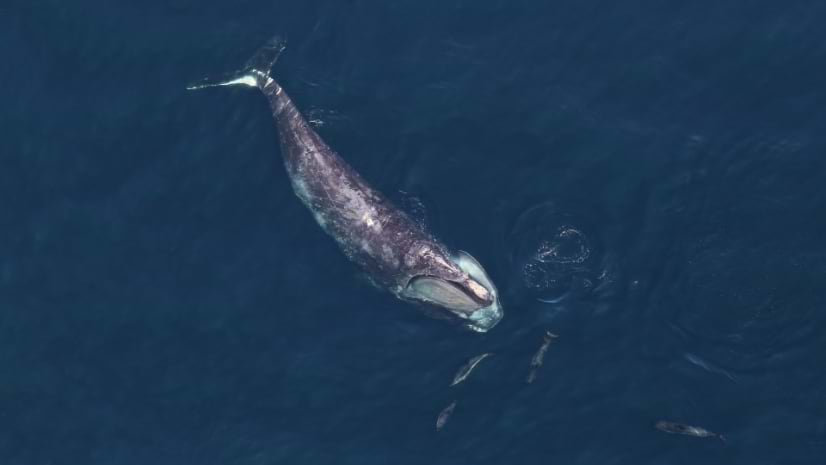
A North Atlantic right whale with five dolphins in Stellwagen Bank National Marine Sanctuary. Photo taken under MMPA permit #17335 by Allison Henry/NOAA.
Even the name of the North Atlantic right whale serves as a reminder of their fraught history with humans. Eighteenth-century whalers considered them to be the “right” whale to hunt due to their slow swimming speeds, tendency to float when killed, and valuable oil and baleen. By the early 1900s, these intelligent and social mammals faced extinction.
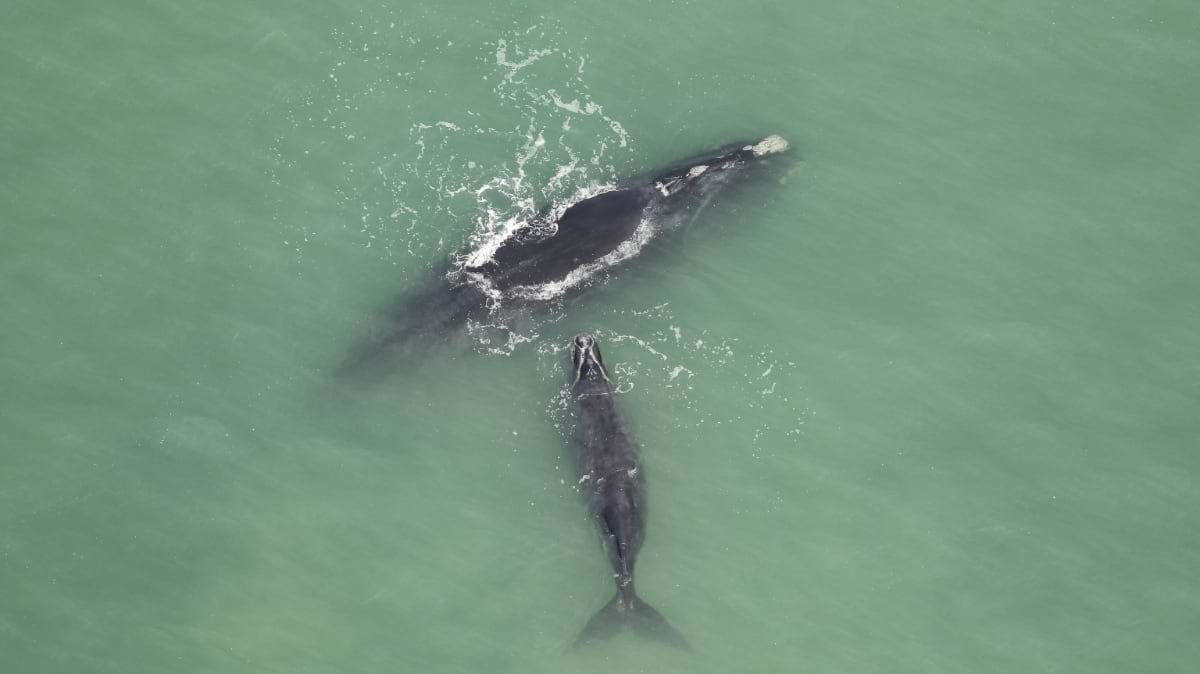
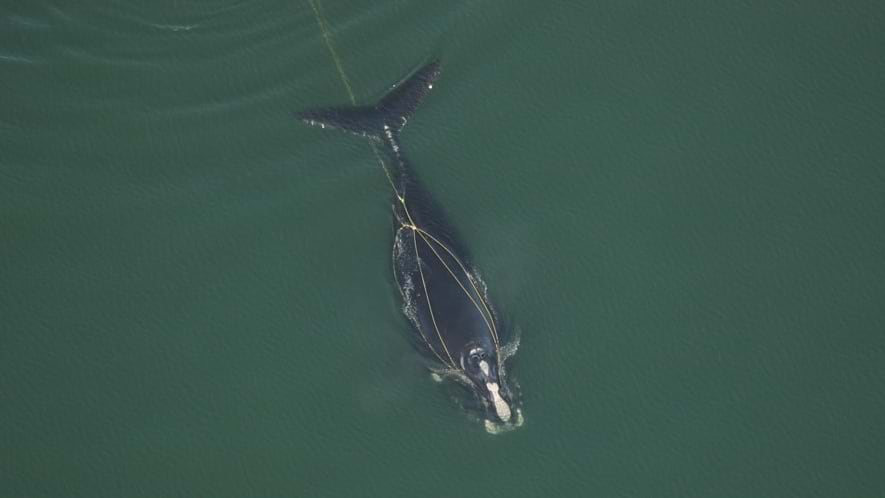
While whaling no longer poses a threat, vessel strikes and fishing gear entanglements continue to harm and kill critically endangered North Atlantic right whales. Only 350 animals remain, navigating a seasonal migration along the busy coastal waters from Florida to Canada. Right whales must surface to breathe and often feed near the surface, which puts them at greater risk for human-related injury. Their poor eyesight and lack of echolocation abilities add to their peril.
Because the survival of the species depends on protecting each whale, marine researchers at Duke University’s Marine Geospatial Ecology Lab set out to find and predict the right whales’ movements. Researchers used geographic information system (GIS) technology to develop a model showing where whales are likely to be; the resulting map of hotspots helps humans stay out of their way.
“Our lab focuses on taking data and observations and processing them into information that is useful to decision-makers,” said Patrick Halpin, the founder and director of the Marine Geospatial Ecology Lab. Halpin and his team research marine ecology, resource management, and ocean conservation. They build technology tools and data layers that make complex marine ecosystems easier to understand. Their work supports ocean management and governance that helps safeguard marine species.
After right whale hunting was banned in 1935, the population rebounded. North Atlantic right whale numbers reached a post-whaling peak of 483 individuals by 2010, creeping back toward the thousands of whales that once roamed the East Coast.
However, a concerning behavioral shift has led to a decline.
“Things started to change,” said Jason Roberts, a former software engineer turned scientific researcher at the Marine Geospatial Ecology Lab. “The right whale population leveled off. Suddenly, whales started showing up in places no one had seen them before.”

As right whale migration and feeding patterns shifted, the animals began entering areas that lacked protections—with deadly consequences.
A catastrophic 2017 incident in the Gulf of Saint Lawrence in Canadian waters killed 12 North Atlantic right whales. Post-mortems revealed many had been hit by vessel strikes or caught in fishing gear entanglements. Investigators found a fleet of crabbing boats had been operating in the gulf at the time.
Scientists at the National Oceanic and Atmospheric Administration (NOAA) recognized that the species’s survival hinged on fast and precise intervention. NOAA Fisheries declared an Unusual Mortality Event to mark the significant die-off of the right whale population.
“NOAA wanted to do something,” Roberts said. “And they needed to have a detailed understanding of where this animal was and where it would be.”
Since the peak in 2010, more than 25 percent of the North Atlantic right whale population has been lost, leaving fewer than 70 breeding females.
“It’s to the point where, if a single mother or calf is killed by a ship strike or something, then that’s a big blow to the genetic population,” Halpin said.
Although the Marine Geospatial Ecology Lab had an existing density model for right whales, NOAA scientists wanted a more accurate update on whale behavior. A new model, outlined in a paper published earlier this year, incorporates the most current visual surveying and acoustic monitoring data.
To update the density model, lab researchers needed extensive right whale data. Most whales are not visible via satellite, and the electronic tagging of more than a few animals is costly and invasive. Halpin and his colleagues relied on the combined efforts of the science community to survey the population.
Leading a collaboration of 11 organizations, the researchers compiled survey data collected via aircraft and ships along the entire Eastern US coastline during a 17-year span.
Researchers also collected acoustic data from 500 underwater microphones, known as hydrophones, that NOAA installed as part of the Right Whale Listening Network starting in 2004. The passive acoustic sensors help find whales when they can’t be seen. In addition, numerous federal, state, and private organizations shared their data, including NOAA Fisheries and the Bureau of Ocean Energy Management.
Researchers at the Marine Geospatial Ecology Lab used GIS to analyze and connect all the visual and acoustic data layers in the context of location. Plane and boat surveys provided data on whale locations, while hydrophones captured right whale calls. The hydrophone recordings offered a new way to validate the visual findings and assess the accuracy of the density model.

In addition to visual and acoustic data, Roberts and his colleagues considered ocean currents, surface temperature, and chlorophyll concentrations monitored via satellite. Real-time measurements of these variables strengthened predictions about whale distribution.
For example, where chlorophyll levels are higher, researchers expect to see more right whales. That’s because chlorophyll indicates algae, the food consumed by the tiny crustaceans that make up most of the whale’s diet.
Researchers theorize that behavioral shifts among North Atlantic right whales can be attributed to warming ocean waters. “The reason why their patterns have changed is essentially because the distribution of their food has changed,” Roberts said. “And the reason why that has changed is because of climate change.”
In the past, most of the North Atlantic right whale population spent their summers feeding in and around the Gulf of Maine. However, rising ocean temperatures in that area have caused their primary food source to migrate northward into colder waters. This shift has prompted right whales to seek out new summer feeding grounds, exposing them to new threats in the process.
The right whale density model estimates where whales will be each month on a dynamic map. Decision-makers use the model-driven map the way farmers might use an almanac, guiding current and future actions based on statistical analysis of recorded observations.
“The goal of these models is to make maps that show the absolute density of the animals,” Roberts said. “You can go to a location and predict how many whales you’re going to find there.”
The ability to see across time and space is crucial. The model helps agencies such as NOAA and the National Marine Fisheries Service design and enforce seasonal right whale speed restrictions. Offshore wind energy developers leverage the model to find the best times to build to mitigate threats to vulnerable animals.
“The US Navy is required to do environmental impact studies for all their training and exercises,” Halpin said. “They need to know when and where marine animals are going to be in the water so they can choose times and locations that won’t have a major impact … There are many, many users of the model.”
As more data is collected and technology advances, the lab and its partner organizations continuously update and refine the model.
Halpin, Roberts, and their colleagues have built GIS-powered density models for 31 different marine animals. Right whales are among six endangered species being researched and mapped.
The lab maintains the publicly available model repository and GIS mapping tool for marine mammal density. Scientists and researchers can access this information to understand which areas are important to each species for feeding, giving birth, or another critical purpose. They can also use the tools to determine critical areas for multiple species by layering the data on combined density maps. These stacked maps show species diversity and help identify essential habitat areas for ocean conservation.
Roberts is eager to take the next step in advancing the Lab’s density models. “We’re moving to a system where all the data will flow continuously, and the model will update continuously. This is what we’re calling the ‘near real-time’ modeling system.”
As visual, acoustic, and oceanographic data is recorded, a near real-time model will update predictions automatically. If the current model is like a yearly almanac, the near real-time models are like a 10-day weather forecast.
“You can look at a radar map of where there are storms in your area,” said Roberts. “We want to do the same thing with right whales.”
Learn how GIS technology is used in ocean science, conservation, exploration, and data collection.