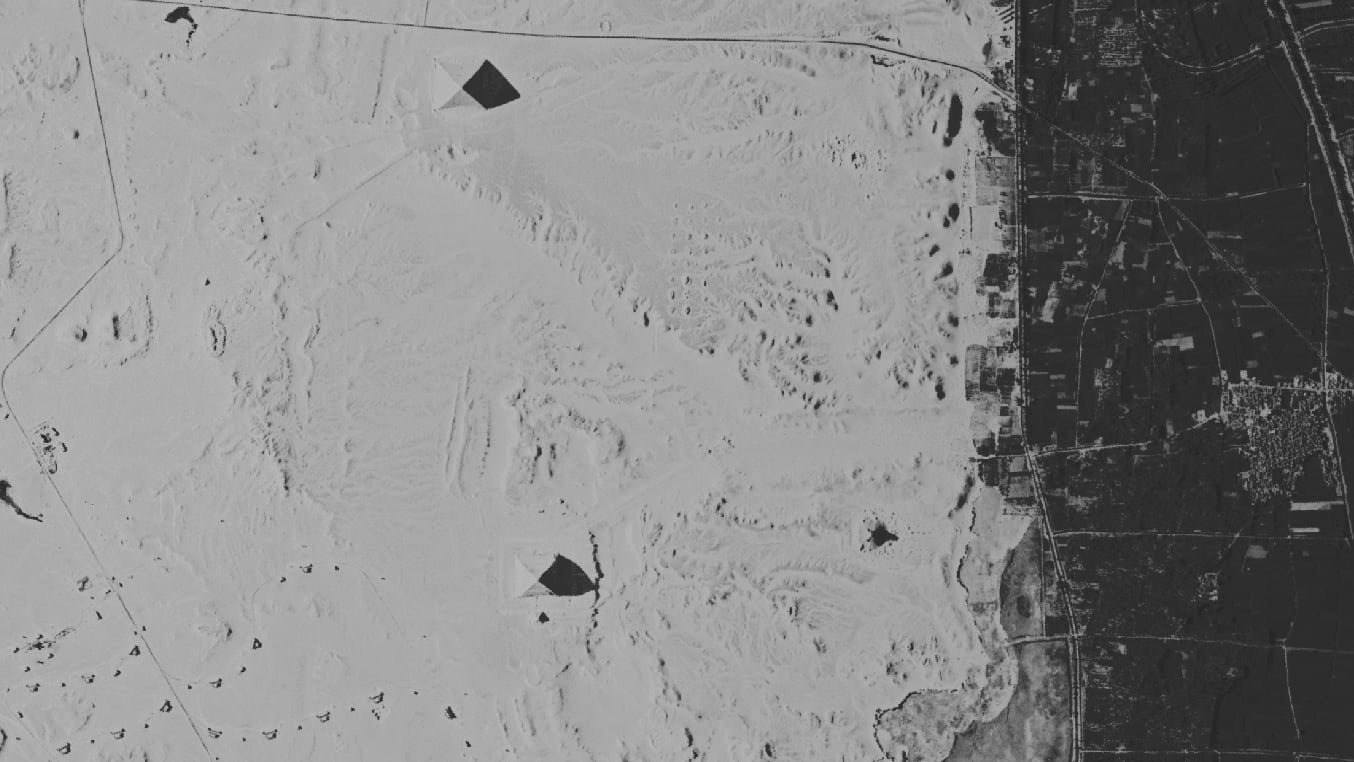


Throughout the 1960s and 1970s a top-secret US program dubbed Corona by the Central Intelligence Agency (CIA) captured satellite images of Soviet military installations. Now, the more than 850,000 photographs can help scientists analyze human impact on Earth through the decades—changes like tree loss and urban sprawl.
Declassified in the 1990s, the massive imagery collection remains mostly disorganized and stored on film. Each image must be developed and manually identified with its exact place and time—an arduous and expensive process. Recent technology advances are giving the Corona project new purpose. Researchers are digitally correcting the sometimes blurry images and using geographic information system (GIS) technology to orient the images in space and time, at scale.

The more data that scientists can collect and analyze from the past, the more accurately they can model what will happen in the future. In the 1960s, just as the Corona project was launching, early concepts of quantitative and computational geography emerged. Decision-makers quickly grasped the power of these approaches to solve problems, and the first GIS launched in 1963. As Corona satellites began circling the earth, Esri was getting its start with applied computer mapping and spatial analysis. The tools, first created to help land-use planners and land resource managers make informed decisions, were eventually released as software.
Today, GIS endures as an enterprise technology uniquely able to analyze data from nature, society, and business. It’s capable of taking enormous amounts of information from different sources and distilling it to be comprehensible and actionable for nearly anyone. GIS is as useful in understanding water scarcity as it is in optimizing business operations via a digital twin.
One team in Saudi Arabia is using GIS and satellite remote sensing methods to study shoreline changes in Yanbu, the world’s third largest oil refinery. The location intelligence gathered from their study is allowing the team to understand how human development has impacted the shoreline since 1965—an understanding that wouldn’t be possible without Corona imagery. They’ll use that data to predict the continued threat to natural coastal systems and project the consequences of that damage through 2109.
Another group of researchers is studying Nepal’s second largest lake, Phewa Tal. Scientists have long believed that the lake was shrinking but it’s been disputed due to a lack of historical data in the region. Team members analyzed old maps and Corona satellite imagery using GIS and artificial intelligence (AI) to understand lake shrinkage over time. Their analysis revealed that landslide activity, sedimentation via the watershed, and urban development will cause the lake to lose 80 percent of its storage capacity over the next several generations if left unaddressed.

During its tenure, the Corona project yielded nearly a million images. The first satellite alone returned more imagery of the Soviet Union than the entire U-2 high-altitude reconnaissance aircraft program. At the time, there was no ability to digitize these images or put them in a database.
Now GIS tools allow researchers to display many images and catalog and compare them. Users can navigate through multiple layers of imagery to look across space and time. This visual comparison is just a start, with great value derived from imagery analysis that goes beyond what the eye can see.
Imagery is cell-based, with each pixel containing values that the GIS can classify for layers of information such as land or vegetation type. Using a geoprocessing model, datasets can be derived directly from imagery. Most imagery analysis work is now automated, using the computing capacity of the cloud to process and store a daily refresh of new images provided by today’s satellites. Applying the AI method of machine learning allows computers to detect objects and pull out such things as building footprints or missile launching sites.
By late 1960, data derived from Corona imagery allowed the director of the national reconnaissance program to declare confidently that the Soviet Union did not possess more strategic nuclear weapons than the US. Reaching that conclusion required many more human hours than would be necessary with today’s technology.
Prior to the release of the Corona images, satellite imagery only stretched back to 1972 when the first Landsat satellite began transmitting digital images of the earth from space. Despite being static and black and white, the Corona images are of much higher resolution than their Landsat counterparts since they were taken closer to the surface and at the optimal time of day for discerning objects on the earth’s surface.
Researchers rely on historical information collected from books, photographs, journals, artwork, and other sources to help extend the timeline of understanding. Projecting that knowledge into the future, they use imagery with GIS analysis to assess risk and vulnerabilities across a wide range of industries and areas of study. To gauge systemic threats like climate change and sea-level rise requires a long view—sometimes at least 30 years of data.
For instance, scientists are using detailed logs from whaling vessels to understand what climate and marine conditions were like in less-traversed areas of the ocean in the 19th century. Others venture into caves to collect samples from bat guano for an accurate snapshot of the climate in that area over time. Photos taken by Cold War spy satellites fit into this category as well.
One of the first people to recognize the potential usefulness of the Corona images in studying our planet was Vice President Al Gore. In 1990, then-Senator Gore wrote a letter to the CIA asking if Corona satellite imagery could be used to help solve environmental mysteries. The resultant MEDEA program, led by 70 scientists, became one of the greatest sources of earth science data in the world. Information from MEDEA’s Global Fiducial Data Network assists in monitoring critical environmental parameters today.
As technology advances, researchers are finding new ways to access incredible volumes of data. For bigger issues such as climate change, they need information that spans across time. When scientists combine Corona images with GIS, they can see changes through the decades—insight crucial to making more informed decisions to protect the planet.


