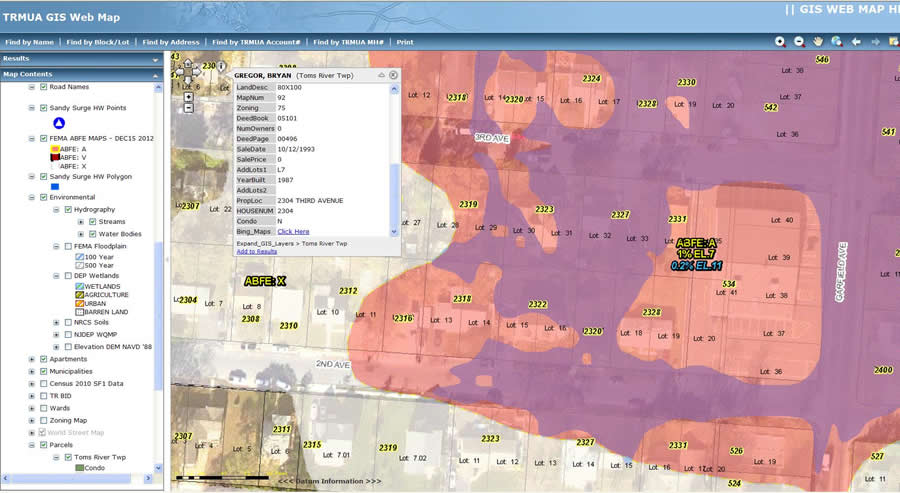
It started as a free, public sewer infrastructure map for Toms River, New Jersey. Len Bundra, IT and GIS director for Toms River Municipal Utilities Authority (TRMUA), built it in 2004. Then, he kept adding layers. He added aerial imagery, parcel data, and information from agencies such as the New Jersey Department of Transportation, the US Department of Agriculture, and the US Census Bureau. Bundra had one belief in mind: “If you build it, they will become aware.”
He was right.
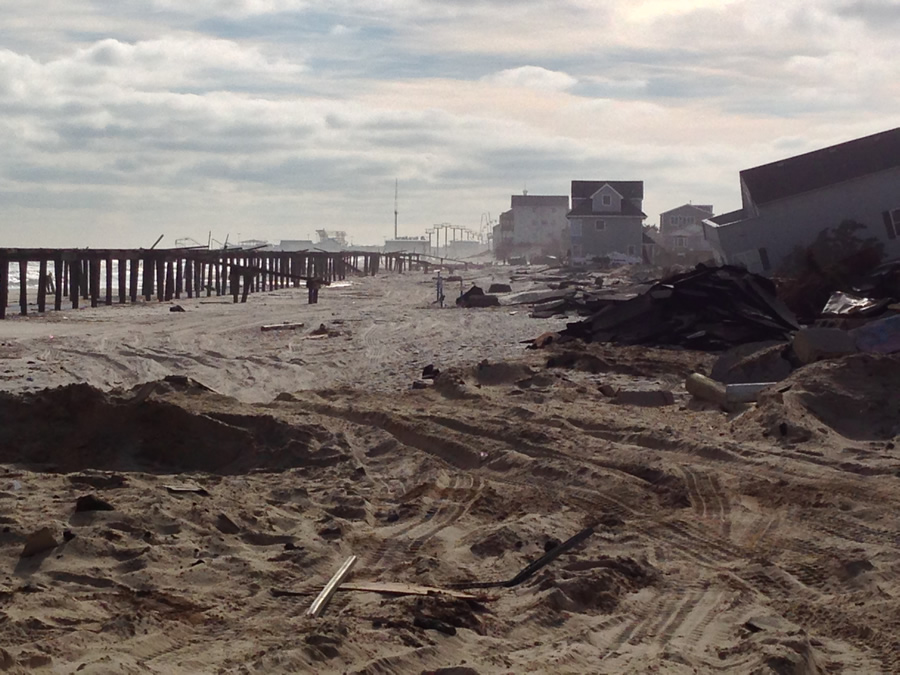
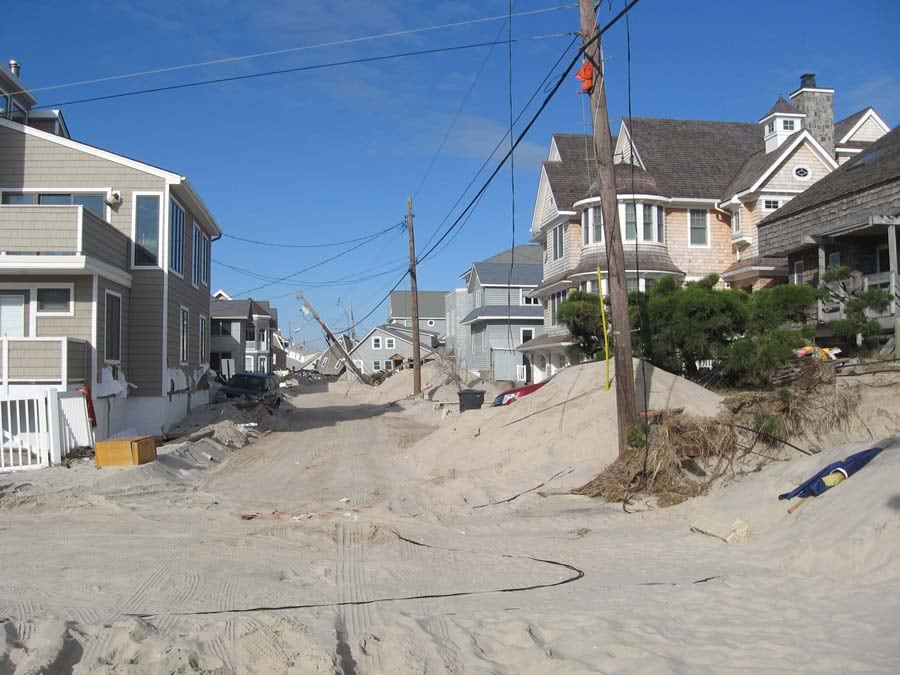
When Hurricane Sandy hit the East Coast of the United States in October 2012, the map suddenly became the go-to information source for emergency responders, utilities, public works, private surveyors, and local assessors. Bundra quickly updated the map—known officially as the TRMUA GIS Map. He added post-storm satellite imagery from the National Oceanic and Atmospheric Administration (NOAA), along with current floodplain delineations and Sandy high-water mark data from the Federal Emergency Management Agency (FEMA).
Anyone who needed to quickly get an accurate picture of the Sandy situation could click on the TRMUA GIS Map. Bundra built it, and people did come. Police and fire fighters came to determine where to deploy resources. Electric, gas, and water companies came to decide where to start restoring services. Homeowners, evacuated and eager to survey the damage to their property, came to look at before-and-after aerial photos. And, as Bundra predicted, people most definitely did become aware.
Anyone who needed to quickly get an accurate picture of the Sandy situation could click on the TRMUA GIS Map. Bundra built it, and people did come. Police and fire fighters came to determine where to deploy resources. Electric, gas, and water companies came to decide where to start restoring services. Homeowners, evacuated and eager to survey the damage to their property, came to look at before-and-after aerial photos. And, as Bundra predicted, people most definitely did become aware.

“The map served as a valuable resource for the police department after Sandy,” said Mike Burke, IT and 911 coordinator for the Toms River Police Department. “We relied on that visual representation—the before-and-after layers—to set up security perimeters and determine where to place cement barriers.”
Since the TRMUA GIS Map was built on the Esri ArcGIS platform and hosted by Amazon Web Services, it provides virtually unlimited power for data sharing, analysis, collaboration, and spatial data processing.
Following the storm, many outside contractors arrived on the New Jersey shores to restore the region’s infrastructure. One group in particular was the engineers who needed to figure out the best plan for repaving roads mangled, buried, or washed away by the storm. The TRMUA GIS Map helped them find their way around unfamiliar areas. They used the map to locate important elements such as parcels, street addresses, hydrants, and underground utilities.
In the weeks and months following Sandy, the map continued to help. Utilities used it to review parcel polygons on the barrier islands to identify houses and neighborhoods that were destroyed so those ratepayers would not be charged for the year 2013. The map’s links to FEMA flood advisory maps is helping affected townships adopt a new flood insurance risk map. Bundra also recently added a layer to show houses that are slated for demolition and/or labeled uninhabitable, which helps to advise citizens and utility companies on where to focus rebuilding infrastructure.
For TRMUA, the GIS map continues to serve as a hub.
“The Toms River MUA GIS map is a comprehensive, one-stop shopping database of all useful pieces of information for everyone within the MUA, as well as contractors, plumbers, consultants, and more,” said Nicholas Otten, authority engineer for TRMUA. “All various pieces of data are centralized and accessible by every MUA department within the office or in the field.”

Before Bundra created the map, Otten said TRMUA engineers had to sift through a room of drawers with thousands of engineering drawings for information or request data from other departments or agencies. Often, they would have to send out crews for field visits. Now everything they need is on the computer screen with an aerial basemap.
Otten says he can now view maps of all 430 miles of pipe, 9,600 manholes, and 18 pump stations, along with all attributes. At a glance, he can see whether a pipe or manhole has been inspected or rehabilitated and then simply click to view an inspection report or video. He can access various aerial maps, including post-Hurricane Sandy and aerial basemaps from as far back as 1930. He can tell when a service lateral has been cut and capped and see the triangulated location sketch of the curb cleanout.
The map shows all billing information, including the recorded number of fixtures within a building. It also shows pump station data and the number of connections that flow to the station, hundreds of pages of data on emergency generators, wiring diagrams, pertinent engineering drawings, and pump curves.
“With a few clicks, I am also able to generate specific reports,” Otten said. “With GIS, I can determine the approximate, average flow within any given pipe segment. I can list pipes and manholes by name. I can find the names and mailing addresses of property owners within 200 feet of one of our construction projects.”

History of GIS at TRMUA
TRMUA began its GIS work in an effort to assemble 40 years of paper plans and files into a centralized mapping interface. The system was built entirely by in-house staff without the use of any outside consultants and was completed within two years.
All 9,600 of TRMUA’s sewer manholes had exact coordinates verified in the field using submeter GPS units. More than 600,000 line and manhole attributes were entered into an Esri geodatabase from more than 3,000 engineering plans.
An entire GIS parcel basemap also was created from scratch to include additional elements not typically found on the tax maps. For example, 3,000 individual condo units and all major apartment buildings were added to the basemap, which was then aligned to New Jersey State and United States Geological Survey orthophotography.
The system is now available for all TRMUA office staff across an internal network and to all field staff via ruggedized laptop units.
“The GIS has increased operational efficiencies across all departments by allowing instantaneous access to data that previously had to be searched for among reams of paper files and plans,” Bundra said. “The GIS also allows our field crews access to all the information they need to quickly assess and properly address emergency situations.”
