Society today faces many unique challenges that impact cities in every country. Governments, businesses, health care, social services, and other types of organizations must plan for higher population and housing density in urban areas, maintain and increase open space, and decide where to locate services for youth and senior citizens.
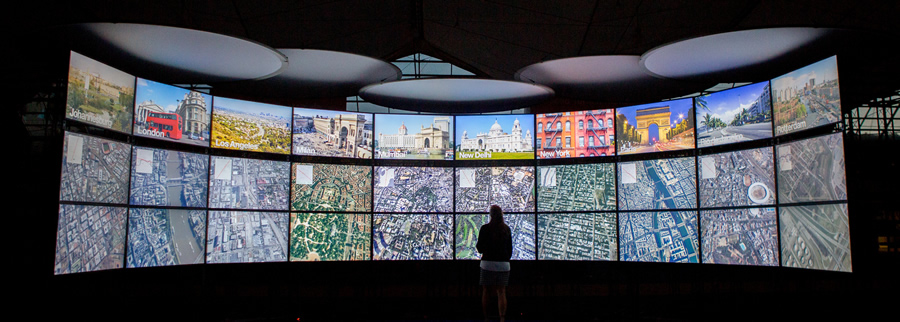
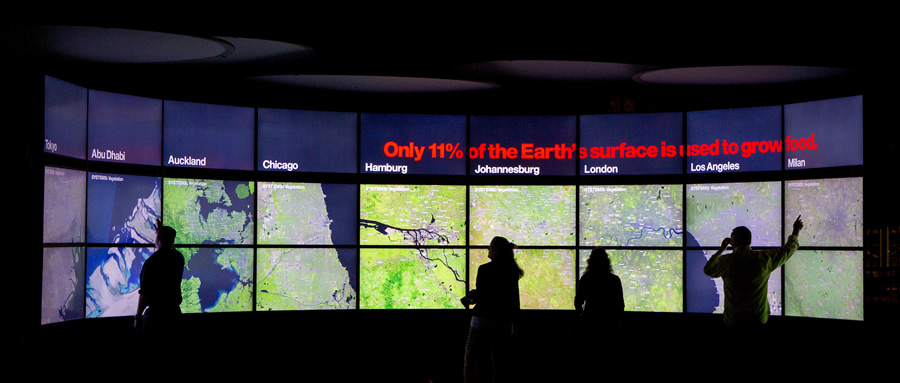
Enter the Urban Observatory, a project by Richard Saul Wurman, Radical Media, and Esri that creates an interactive museum experience that uses digital maps and the power of geospatial analysis to bring important and interesting data collected about our cities to life.
You can compare and contrast data for three cities at once. Data that’s available includes commercial and industrial land use; new development; population and housing density; traffic; current temperatures; wind speeds; the youth and senior citizen populations; open space; and more.
By visualizing data using digital maps and advanced display technology, you can interact with information about cities around the world like never before. You can currently view data for 19 cities, including Paris, France; Abu Dhabi, United Arab Emirates; Mumbai, India; Johannesburg, South Africa; Rio de Janeiro, Brazil; and New York, New York, and Los Angeles, California, USA.
The Urban Observatory consists of two components: exhibits and an interactive website. The exhibit provides a unique, immersive experience unlike any other. Dynamic data, digital maps, and related content are derived from many sources. The website supplies the data and functionality to easily view and interact with all types of information.

