The 2024 Esri User Conference (Esri UC) was a gathering of some of the most capable geospatial minds from around the world. The conference was organized with a distinct purpose: to provide space for these GIS professionals to share and exchange ideas about how to make the world a more united and sustainable place to live.
Held in San Diego, California, July 15–19, the conference was attended by over 21,500 registrants, with more than 14,500 tuning in online. It also included hundreds of presentations and showcases that spoke to the theme of the conference: Uniting Our World.
“Geography organizes everything we know,” said Jack Dangermond to kick off the Plenary Session. “This magical word where is an extraordinary word because it connects all of humanity to all the science. The where is a powerful thing. It’s your bridge to everyone else on the planet.”

Esri UC gave life to that idea, connecting attendees over the five-day event with networking opportunities, training seminars, and technical demonstrations. Presentations throughout the week spoke to the technologies and initiatives that allow GIS users around the world to improve their work and their communities. And on the Plenary stage, Dangermond recognized many of these people and organizations by awarding Special Achievement in GIS (SAG) Awards, the Making a Difference Award, Enterprise GIS Award, and the President’s Award.
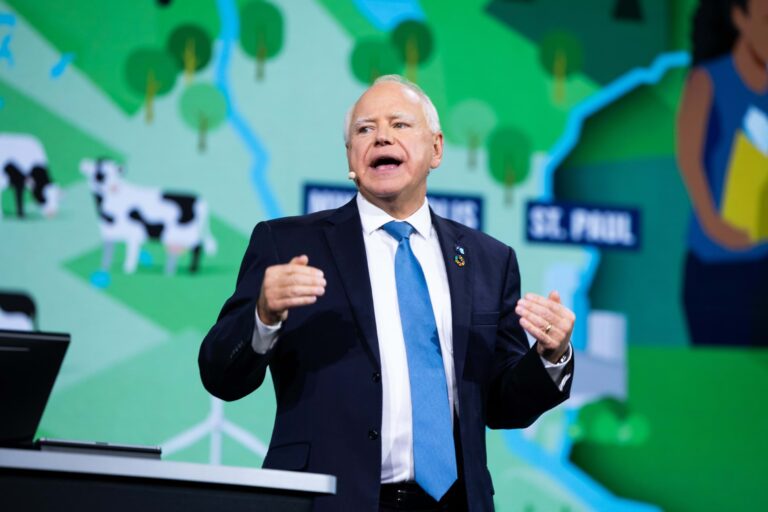
The Plenary Session also featured many GIS analysts and engineers who showcased the transformative work they have been doing in their communities. These presentations were followed by keynote speakers such as National Geographic Explorer Jeff Kerby, as well as Minnesota Governor Tim Walz—now the Democratic nominee for vice president of the United States—who described what it meant to be a “servant leader” who uses data and GIS to drive success.
Every Plenary presenter emphasized how their organizations are using GIS to not only serve their communities but also unite their worlds.
More Than Just Mapping
Located in southeast Florida, Miami-Dade County is nearly as large as the state of Delaware. It is also home to more than 2.7 million residents.
County staff developed GIS parcel layers starting in 1990, introduced the county’s first web-based GIS app for residents in 1997, and created a GIS-based wastewater data management system in 1998.
Many of Miami-Dade County’s GIS successes are related to making long-term investments in Esri’s low-code and no-code products, which has enabled staff to produce nearly 500 business-centric apps for 25 county departments and residents. For example, county staff used ArcGIS Urban to plan locations for 216 new housing units, and created a web page with ArcGIS Hub and its AI assistant to enable residents to find cooling centers during heat waves.
GIS also plays a key role in the county’s No Wrong Door initiative, which helps ensure that every person’s first point of contact with the county is met with the seamless, comprehensive, and compassionate delivery of government services.
Jose R. Rodriguez, the division director for the county’s IT department, described a new GIS app that supports county departments, municipalities, and state agencies in their work on infrastructure projects for road management.
“This application aims to reduce disruption and save money by identifying collaboration opportunities,” Rodriguez said, noting how the county employed ArcGIS Indoors, Urban, and Esri’s new Road Closures solution. “With our efforts, we’re going to be helping drivers ride to a destination more efficiently.”
In addition, staff can assign appropriate county employees to hurricane evacuation shelters based on the employees’ areas of expertise.
“We’re seamlessly opening virtual doors, physical doors, to our employees and to our community, and that’s because of the partnership that we have with Esri,” said Jose L. Lopez, the assistant director for the county’s IT department.
Ahead of the Flow
Central San, a wastewater treatment agency in Contra Costa County, California, provides wastewater collection, treatment, and disposal services; recycled water production and distribution; and household hazardous waste collection to nearly half a million residents and more than 15,000 businesses.
Although Central San’s GIS team is small, it has been able to streamline its everyday work and significantly improve the impact of its community’s environmental stewardship. Central San has accomplished this largely through its use of ArcGIS Utility Network for wastewater asset management.
Khae Bohan, asset management program administrator for Central San, and GIS analyst Carl Von Stetten laid out their use of Utility Network, demonstrating how it is employed to model complex assets, such as maintenance holes, and enable staff to operate more efficiently both in the office and in the field.

“[Utility Network] has become the foundation for our enterprise network management system,” said Von Stetten, who emphasized that the software allows for more precise communication with crews in the field. For instance, these workers can respond to customer requests by using an app created with ArcGIS Instant Apps that performs a network trace with Utility Network data.
Inside treatment plants, Central San connects its GIS workflows with engineering designs and building information modeling (BIM) data, providing a 3D view of assets in areas that are not physically accessible.
“Having a 3D model allows staff to visualize and interact with each system as a whole in a way not possible with 2D drawings alone,” said Bohan. “This will improve communication and collaboration between consultants, engineering staff, and our operations staff.”
Managing the Seabed with ArcGIS
In the United Kingdom, national landowner The Crown Estate is using GIS to help ensure shared and long-term prosperity for England, Wales, and Northern Ireland. Created in 1760, The Crown Estate helps manage land across the countryside, communities, coastal areas, and the ocean floor.
Presenters described how The Crown Estate considers shipping, fishing, environmental protection, costs, and more in making decisions about where to locate offshore wind farms capable of powering millions of homes.
“We have a responsibility to unlock value for the land and nature through the sustainable management of a diverse portfolio of assets, both on land and across the entire seabed,” said technical and spatial planning director Michelle Moore.

GIS helps The Crown Estate identify, optimize, and balance how marine resources are managed while considering how to reach net-zero greenhouse gas emissions goals, how to boost nature recovery, and how to maintain a thriving marine-based economy. The Crown Estate does this by using the company’s Resource Information and Optimization (RIO) resource management tool, which provides scenario-based geodesigns augmented by community input that is collected using interactive crowdsourcing apps built with Hub.
“We need to engage and work with others to consider the whole of the sea and all of its users,” Moore said. “It’s an act of balance, integrating competing and complementary interests.”
To accomplish this, the RIO shows existing infrastructure, such as oil and gas platforms; legislative data, such as protected marine areas; health and safety considerations; and technical exclusions, including areas that are too shallow for development. This helps The Crown Estate determine where to locate offshore wind farms. Different scenarios focus on issues such as space, costs, and environmental impact.
“It allows us to understand the consequences of those scenarios, both positive and negative,” said marine delivery routemap director Jamie Moore.
Empowering Kuwait by Capturing Reality
Established in 1982, the Public Authority for Civil Information (PACI) in Kuwait has spent years building a geospatial repository for the country’s government and its people. It is a one-stop shop for authoritative data, apps, and services that supports a population of over 4 million people.
“The data is stored in . . . various formats, like papers, scanned documents, CAD drawings, and custom apps,” said Maher Abdel Karim, GIS consultant and program manager for PACI. “We linked them all together and created a comprehensive basemap for the country.”
Karim and his colleagues presented on PACI’s efforts to centralize Kuwait’s location data. In 2013, PACI introduced Kuwait Finder, a mobile app that allows its over 2.5 million users to search for addresses and businesses across the country using an identifier known as a PACI number. This number contains additional information about each location.

As part of its efforts to act as a geospatial authority in Kuwait, PACI has also used GeoAI to map and verify speedbump locations across the country. Further, they created a detailed 3D digital twin of many of the country’s urban and agricultural areas. To construct this model, PACI collected more than 650,000 drone images and generated an orthomosaic using ArcGIS Reality for ArcGIS Pro.
“By leveraging all these outputs, we used ArcGIS Pro and the ArcGIS Reality extension to generate a fused photorealistic 3D model,” said PACI’s reality capture data production team leader Dr. Bedoor Mohammad, as she demonstrated how to navigate the detailed model onscreen. “Isn’t it beautiful?”
Innovative Security and Climate Solutions
With almost 9,000 properties in more than 141 countries, Marriott International is the world’s largest travel and hospitality company, according to Marriott global vice president of engineering and facilities Robert Bahl. But the company’s focus extends beyond hospitality, said Bahl, who described Marriott’s innovative, GIS-powered solutions for managing corporate security and mitigating risk.
By leveraging the Atlas template in ArcGIS Instant Apps as well as ArcGIS Dashboards, Marriott global intelligence employees have immediate access to real-time tactical information on a variety of hazards related to civil unrest, terrorism, and climate change. At the same time, Marriott seeks to reduce its carbon footprint and improve sustainability.
Each Marriott property is assessed and monitored for natural and human-related risks, which helps Marriott implement mitigation measures to ensure the safety of its guests and employees.
“Our story begins with the Global Safety and Security Risk Atlas,” said Marriott senior manager of global intelligence Richard Barta, who noted that this app was built with Instant Apps. “Our team can quickly compare relative strategic risk scores from threats like terrorism, civil unrest, and crime under our threat condition program. We can easily illustrate our security risk analyses, countermeasures, and program compliance into a clean, single-pane window.”

Preloaded layers from ArcGIS Living Atlas of the World also enable the app to help with operations during potential and actual risk events.
Marriott director of operations support and training Agila Kumar described how the company’s engineering and facilities team uses Dashboards to evaluate present and future risks due to extreme weather and climate change impacts, such as heat waves and coastal flooding.
In addition, Kumar said, dashboards show carbon footprints for each Marriott property, helping Marriott with its goal of reducing its carbon footprint by 50 percent by 2030 and achieving net-zero carbon emissions by 2050.
A City in Nature
Finally, representatives from the Urban Redevelopment Authority (URA) and National Parks Board of Singapore (NParks) took to the stage to highlight how the two organizations work together to make Singapore greener and more sustainable.
Due in part to its equatorial climate, Singapore is uniquely vulnerable to climate change. Enter Singapore’s Green Plan, an initiative designed to support the United Nations’ Sustainable Development Goals by converting Singapore into a “city in nature.”
“To achieve this vision, we are preserving our natural capital and creating greenery at different scales within the city,” said NParks director Ow Siew Ngim. “We have already set aside more than 20 percent of Singapore’s land to preserve our tropical rainforest and mangroves.”
As part of this goal, URA has developed a 3D system of record with ePlanner, an app integrated with ArcGIS Enterprise that serves over 1,600 users across more than 40 government agencies. With ePlanner, users can access building data and more than 200 data layers, including those of mainland Singapore’s walking and cycling networks and plans for the city.

“Singapore takes a long-term approach to urban planning,” said URA systems analyst Tan Chun Xiao, highlighting study areas that planners are currently working on.
But Singapore has a tremendous amount of greenery to manage, and with its ArcGIS Enterprise environment, NParks has bolstered these efforts to create a city in nature by developing a GIS ecosystem to handle everything from tree inspections to landscape operations.
“We have more trees than humans,” noted Ngim, showcasing the realistic 3D models of many of the 6 million managed trees in the city. This is one of multiple measures the city has taken to prioritize its natural spaces and features.
NParks’s public tree map, for instance, allows residents to learn more about the city’s foliage and streamlines tree planting and maintenance.
Efforts like this ensure that Singapore’s greenery remains a vital part of a healthy and sustainable community. They also conjure up Dangermond’s remarks from earlier in the Plenary Session—that overcoming existential challenges such as climate change will require significant collaboration.
“It’s going to require uniting around this powerful science that we have—geography,” he said. “And we need to do this urgently.”
Watch all the Plenary Session presentations, including the keynote speeches.