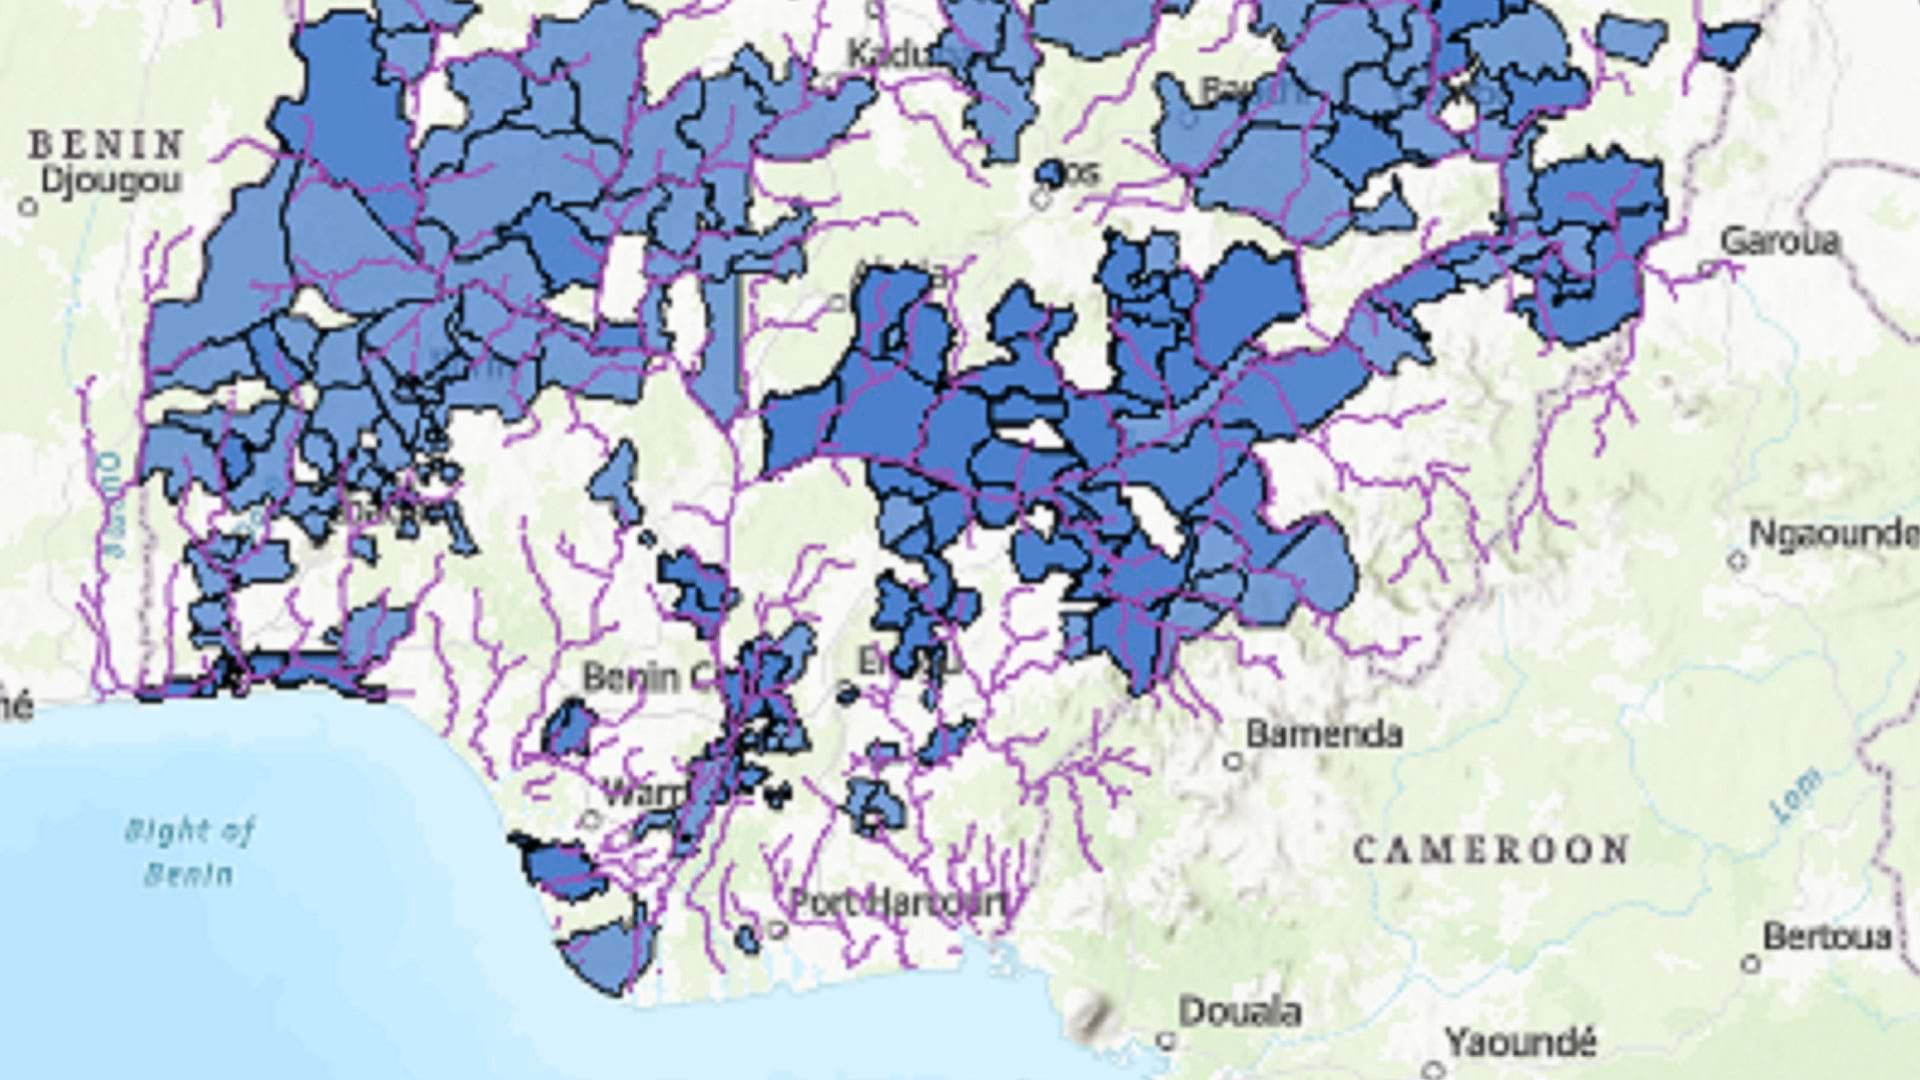
Imagine that you need to create an ArcGIS StoryMaps story that features a map of flood-affected areas. It will be shared on your organization’s website as a public resource. You may want to test your story’s sharing permissions to ensure that it will work when you post it online.
In this tutorial, which involves flooding in Nigeria, you’ll upload data to ArcGIS Online to create a web map with the data, and then create a story with the web map. You’ll publish and share the story and test that it can be viewed without an ArcGIS account. Finally, you’ll update permission settings so that all elements of the story are properly shared.
To follow this tutorial, you’ll need an ArcGIS organizational account with a Publisher, Facilitator, or Administrator role in an ArcGIS organization. (See ArcGIS software access options). This tutorial uses Map Viewer, not Map Viewer Classic.
Step 1: Add data to ArcGIS Online.
In 2022, flooding in Nigeria displaced more than one million people. You have data that shows Nigeria’s rivers and which local government areas (LGAs) were affected by flooding that year. To show this data in an ArcGIS StoryMaps story, you first need to add the data to ArcGIS Online as a feature layer.
To use a file geodatabase in ArcGIS Online, you’ll need to upload a zipped copy of the .gdb file.
Click this hyperlink: Nigeria geodatabase. A zipped geodatabase (.gdb) file named Nigeria.gdb.zip will download to your computer. Do not unzip it.
A common data format for desktop geographic information system (GIS), a zipped geodatabase file is a container that stores multiple layers of spatial and nonspatial data.
Sign in to your ArcGIS organizational account. On the top ribbon, click the Content tab, then click New item, at the top left.

Drag the Nigeria.gdb.zip file to the New item window. (Alternatively, click Your device, then scroll to the file.)
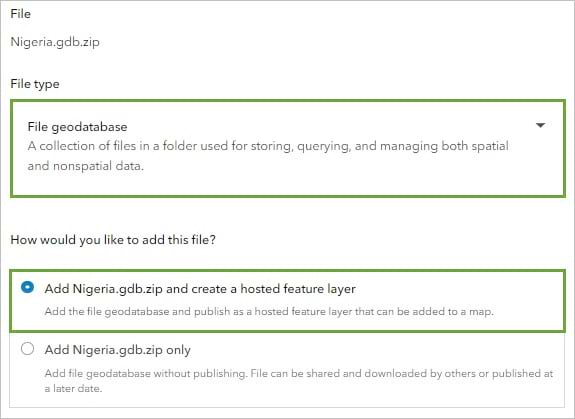
Under File type, click the black arrow on the right and choose File geodatabase from the drop-down options.
Under How would you like to add this file?, ensure that the first option—Add Nigeria.gdb.zip and create a hosted feature layer—is selected. Click Next. This creates two new items in your ArcGIS Online account: a copy of the file geodatabase, and a feature layer created from the contents of the file geodatabase. You will need the data to be in the feature layer format before it can be used to create maps in ArcGIS Online.
A New item window now appears. In the Title text box, replace any existing text by typing “Nigeria Flood” followed by your name or initials (for example, Nigeria Flood YN).
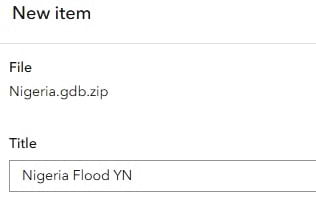
Note that you cannot create two layers in an ArcGIS organization that have the same name. Adding your name or initials to a layer name helps ensure that other people in your organization can also complete this tutorial. Once a layer has been created, you can rename it in the map to remove your name or initials. This will not affect the name of the underlying data layer.
Click the Add a summary line. In the box below the Summary heading, type “Flood-affected areas in Nigeria, 2022”. (These details can be modified later.)

Click Save.
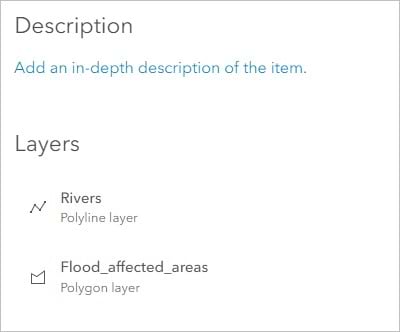
The item page of the new Nigeria Flood feature layer appears. It contains two sublayers that are listed under the Layers heading: Rivers and Flood_affected_areas.
Step 2: Add the data to a map.
Now that your data exists in ArcGIS Online as a feature layer, you will add it to a map.
Hover over the image under Edit thumbnail, then click Open in Map Viewer. (Depending on your organizational and user settings, you may have opened Map Viewer Classic, which is scheduled to be retired in early 2026. ArcGIS Online offers two map viewers for viewing, using, and creating maps. For more information on the map viewers available and which one to use, please see this FAQ. This tutorial uses Map Viewer.)
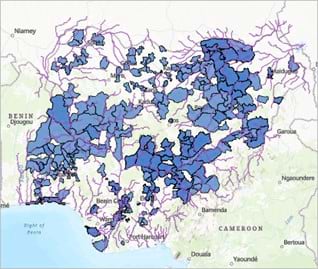
A map appears, zoomed to Nigeria. It contains lines representing rivers and polygons representing areas affected by flooding in 2022.
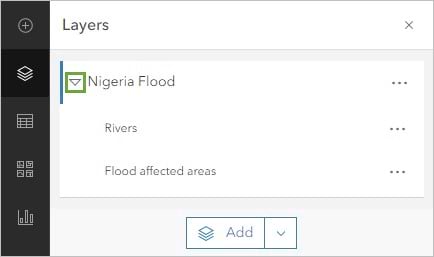
In the Layers pane on the left, click the arrow next to Nigeria Flood to expand the feature layer. The two sublayers are listed.
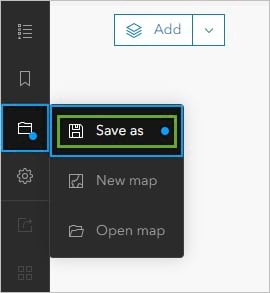
Next, you’ll save the map.
On the Contents (dark) toolbar, click the file folder icon. Click Save as.
In the Save map window, for Title, type “Nigeria Floods 2022”.
Click Save.
Step 3: Share the map in a story.
Now that you have a web map displaying your data, you’re ready to present it in an app. Apps are the recommended means for sharing web maps. They allow you to display contextual information such as titles, legends, text, pictures, and interactive tools alongside maps.
Several ArcGIS products allow you to build different kinds of apps. In this tutorial, you’ll share your map using ArcGIS StoryMaps because you plan to include a lot of text and images in addition to the map.
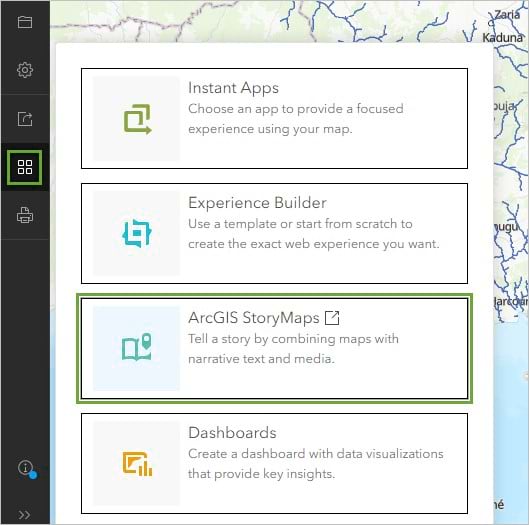
Point to the Contents toolbar and click the Create app button, then click ArcGIS StoryMaps.
The story builder appears.
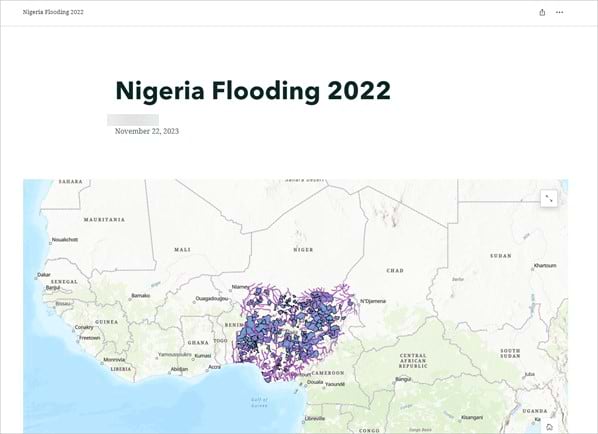
Click Story title, then type “Nigeria Floods 2022”.
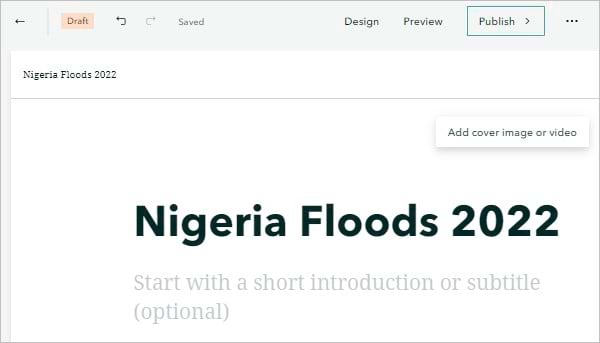
Your map appears in the story.
Below the map, click Add a caption, then type “LGAs affected by flooding”.

Later, you can add text and images and perhaps another map. For now, you’ll publish the unfinished story to test that you are able to share it with the public.
On the ribbon at the top, click Publish.
To set the sharing level, choose Everyone (Public).
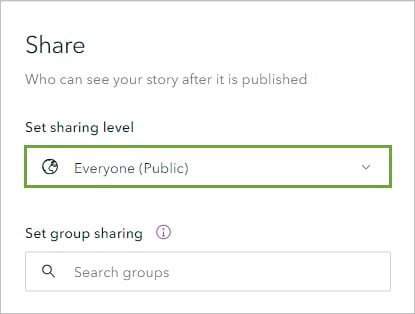
Click Publish.
The Share items? page appears. It prompts you to update the permissions for the web map and layer. (It’s not enough to update the sharing level for the story; you must also update the sharing level for all items inside the story.) Click Yes, share these items.
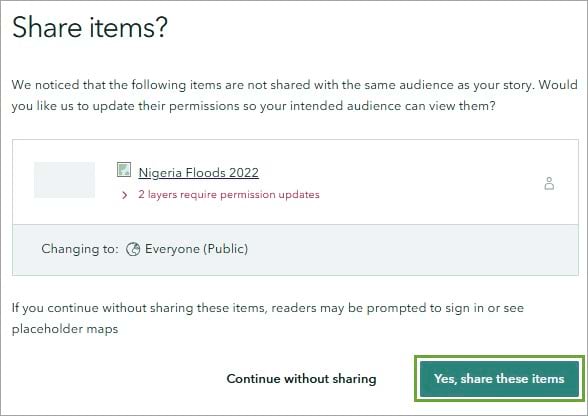
Click View published story.
The published version of the story appears.
Step 4: Test the story.
To test whether people without ArcGIS accounts will be able to view this, you will need to visit the story web page while signed out of your ArcGIS Online account. One way to do this is to use a private browser window.
Click the browser’s address bar above the published story and copy the entire URL.

Open a private window in your internet browser using one of the following options:
- In Google Chrome, click the menu button, then click New Incognito window.
- In Safari, click File, then click New Private Window.
- In Microsoft Edge, click the menu button, then click New InPrivate Window.
- In Mozilla Firefox, click the menu button, then click New private window.
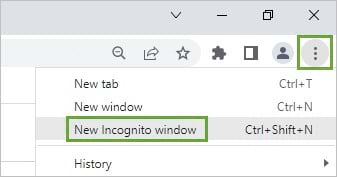
In the new private window, click the address bar and paste the URL of the story. Press Enter.
The story, the map inside it, and the data inside the map should all appear.
In this tutorial, you created a story and ensured that it was properly shared with the public.
You started by uploading data to ArcGIS Online to create a feature layer. Then you made a web map with the feature layer. Finally, you made a story with the web map. You used a private browser window to test that your story was publicly accessible.
The app you created and tested was a story, but the same testing steps will work to ensure that any ArcGIS app is properly shared. Examples include apps created with ArcGIS Dashboards, ArcGIS Instant Apps, and ArcGIS Experience Builder.
Now that you know the story is properly shared, you can work on adding symbols to the map and adding content to the story. You may choose to change the sharing level of the story back to Owner until you are ready to add it to your website.
View this example of a completed story made with the data from this tutorial. You can also watch this tutorial as a video.
