Growing up on Moloka’i, in Hawai’i, Lily Jenkins was exposed to a geographic approach early on in life. Throughout her childhood, Jenkins and her sister Sarah did a “little bit of everything”—tracking endangered shore birds, native plant species, and invasive plant species with handheld GPS units. On these expeditions, Jenkins was introduced to her mentor, Arleone Dibben-Young, a wildlife biologist and ornithologist.
“My early interactions with conservation started with my mom when she was doing this place-based learning workshop with Arleone, and she couldn’t find a sitter, so she brought us along,” said Jenkins. “One of the things that was special about Moloka’i is, you know, our ‘Āina, our land, was our playground, but it was also like our laboratory.”
Dibben-Young taught Jenkins how to use GIS technology, specifically how to import data into ArcGIS Desktop. This tool came in handy for many of Jenkins’s middle and high school projects, experiences that deepened her familiarity with data management and affinity for GIS.
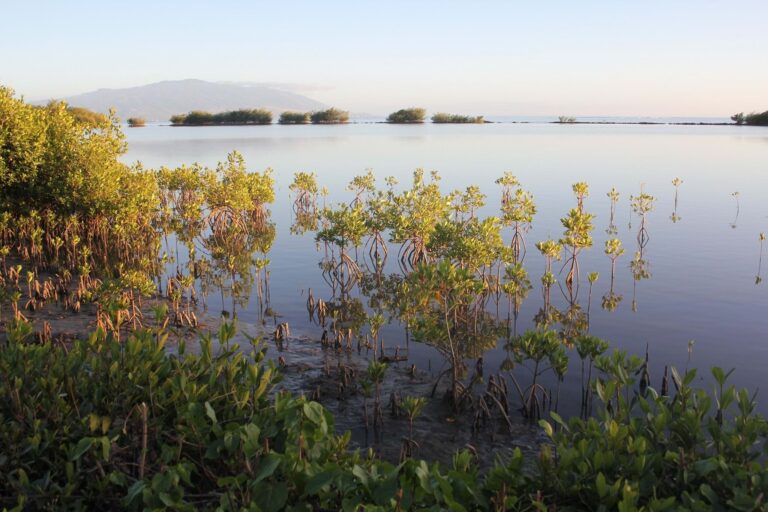
By the time Jenkins was 15, she had a strong grasp of how to use GIS technology. It was, perhaps, this understanding of GIS that helped her observe one day, while paddling downwind from Pūko’o, that the shoreline had changed due to the mangrove’s gradual advance toward the reef.
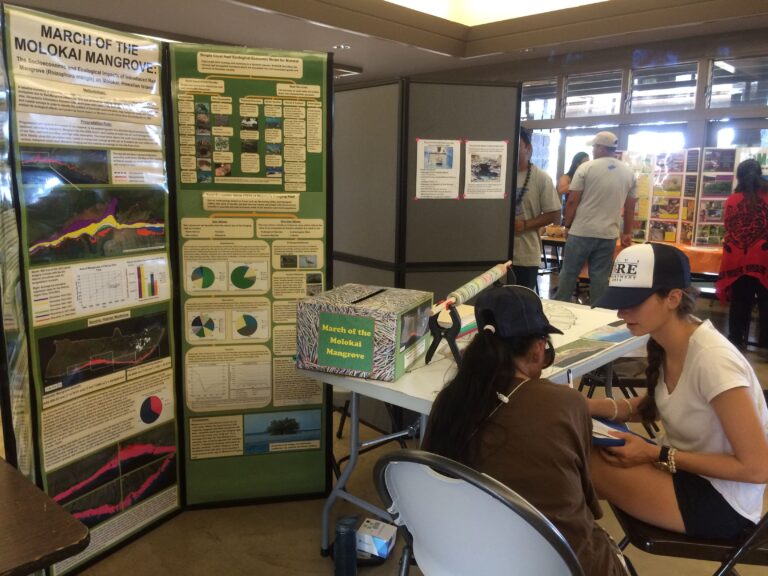
First introduced to Moloka’i in 1905, the mangrove is an invasive non-native plant. Motivated by the changes the mangrove was making to her home, Jenkins worked alongside her sister Sarah on their award-winning project “March of the Molokai Mangrove.” Using GIS, the pair explored the social, economic, and ecological challenges the mangrove posed to the island.
The sisters accessed digitized maps from as early as the late 1800s. They saw where the shoreline started and discovered that the first mangrove had been planted in Pala’au fishpond. They analyzed the mangroves’ impact on wildlife and vegetation and received data from the US Army Corps of Engineers, including hillshades, digital elevation models (DEMs), and bathymetry to create a sea level rise model for Moloka’i with help of mentors Craig Clouet, who worked for Esri, and Ron Abelon with the California Department of Transportation.
“It was clear that this was more than an invasive species problem, so we had to shift our view and the project took on a life of its own,” said Jenkins.
A Conference and a Career in GIS
The end product of the sisters’ hard work was a highly accurate model of Moloka’i’s mangroves and sea level rise, created using ArcGIS Desktop in 2015, later converted to ArcGIS Pro. After their project won first place in its category at Intel’s International Science and Engineering Fair, the sisters had a platform to continue sharing their data and models. This led to them presenting their project to local planning commissions, events, the Aha Moku council, and ultimately the 2015 Esri User Conference.
“Attending the Esri User Conference was a whirlwind,” said Jenkins. “We had usually presented to 100 or 200 people at a time, but 17,000—that put into perspective [what] Esri was. It was amazing, walking the Expo floor with my sister and talking to every person at every booth. I realized I could make a career out of this.”
Now, Jenkins is pursuing her GIS studies while also working as a GIS analyst for Aquawolf LLC, an engineering firm that specializes in design, construction support, and project management for electric and natural gas infrastructure. In this role, she creates GIS products to relay plan information to contractors or clients for design projects. Additionally, she produces maps for environmental compliance and regulations.
Jenkins has been instrumental in expanding the organization’s GIS division. She collaborates cross-functionally with other teams, such as project management and engineering, to create products that improve communication between them. For instance, she has used ArcGIS Experience Builder internally to track project progress, including all phases and milestone updates for underground electrical infrastructure circuits.
During her time with Aquawolf, Jenkins has also helped develop an array of apps, some of which use ArcGIS Survey123 for the company’s fielding, and used GIS to automate other internal processes.
“Aquawolf has been phenomenal, and I’m very lucky to be a part of a company who lets me take all my ideas and run with them,” said Jenkins. “They’ve been supporting me in building our GIS program into all the things I know, and they know it can be.”
Bringing GIS Home in a Time of Crisis
During the early morning hours of August 8, 2023, a brush fire ignited in West Maui near the historic town of Lahaina. High gusts and drought-parched land fueled the fire. Jenkins watched in horror from her San Diego home, knowing she needed to return to Hawai’i to help in whatever way she could.
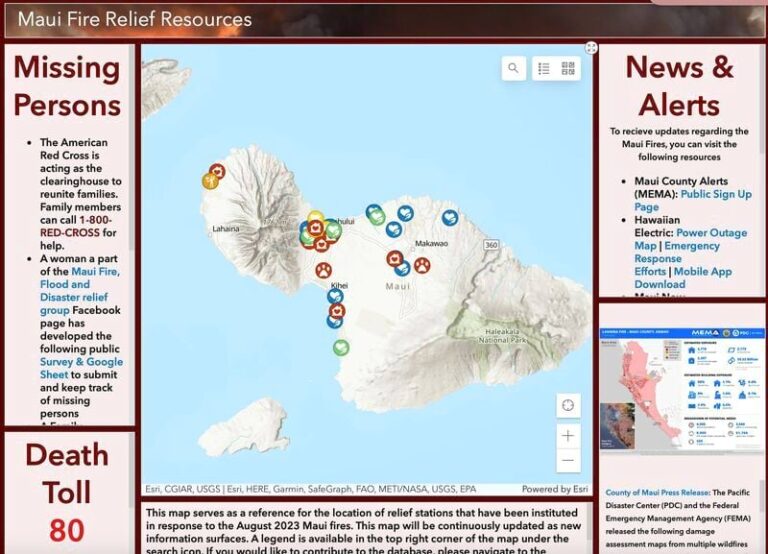
With Aquawolf’s support, Jenkins booked a flight home and remained in Hawai’i for five months. There, she collected information from news outlets, emergency notifications, social media, and various organizations’ websites, using ArcGIS Experience Builder to organize and disseminate that information into the publicly accessible Maui Fire Relief dashboard.
“Immediately following the fires, there was a lot of confusion about where to go, who was doing what, what was actually needed,” said Jenkins. “My hope was that the dashboard could act as a source of truth and help to normalize the flood of information surrounding the fires.”
The dashboard provided data regarding relief sites, where people could donate money or items, animal shelters, and had a survey embedded, enabling users to submit relief-related information. It also caught the attention of a community-led group called the West Maui Community Aid (WMCA), who, during the fire’s early hours, facilitated and managed the various pop-up encampments, also called ‘pods’.” The group was also one of the first to express the concern of protecting culturally sensitive areas such as archeological sites, ancestral remains, and historic buildings.
“Ancestral remains are integral to Native Hawaiian identity,” explained Jenkins. “Iwi kupuna (ancestral bones) sit at the core of one’s connection to ancestry that strengthens and guides our understanding and interaction with our homeland, and collectively, with one another.”
Through Esri’s Disaster Response Program, she was able to access additional ArcGIS technologies to assist in this work. She served as a community liaison and GIS analyst contractor for several weeks with the EPA to help with the monitoring of culturally sensitive areas. The cultural monitoring activities lasted a few weeks until it was passed on to another local organization. She also lent her expertise in creating surveys with ArcGIS Survey123 to help public and communication information officers collect the necessary details for their operations dashboards.
“Although I’m not [from] Lahaina, I am Hawai’ian born and raised,” said Jenkins. “It’s been an honor to be able to use my skill set and everything that I’ve learned from Esri and from my community.”
The Journey Ahead
Jenkins isn’t done giving back and is now looking to the future beyond recovery efforts in Maui. Jenkins aims to collaborate with educators to make GIS tools readily available and user-friendly in classrooms across the islands. She envisions developing a tailored course for high school students to empower students to explore and research a topic they are passionate about, using GIS to complete a capstone project.
“My sister and I started using GIS in our science projects, and it has been amazing to see how it is making an impact in our community,” she said. “In the future, I want students to see GIS as a universal tool where they can do anything with it.”
Jenkins plans to team up with both Esri and local GIS experts to assist Hawaiian K–12 schools in accessing the ArcGIS for Schools Bundle. Her goal is to increase awareness of available free GIS education courses offered by the Esri Academy, and ultimately to establish a mentorship program that directly links students with GIS professionals.
Jenkins acknowledges that her unique experiences, combined with the guidance of influential community figures from her upbringing and her introduction to GIS through Esri, have been crucial in propelling her career success and enabling her to positively contribute to her community.
“My sister and I were able to do our science fair projects with software Esri donated to us and the User Conference was the first time I knew what I wanted to do for the rest of my life,” she said. “Wherever I go from here, I want my footprint to be a positive one. That is the legacy I want to leave.”
About the author