Walk-time maps—the walking version of drive-time area maps—show where and how far pedestrians can travel from a specific point in a certain amount of time. These maps are based on a predefined walking speed (usually 5 kilometers or 3.1 miles per hour ) and paths and roads that allow pedestrian traffic.
In this tip, you’ll learn how to make a walk-time map with ArcGIS Online.
To create walk-time areas, you’ll need privileges to create content, publish hosted feature layers, and perform spatial and network analyses. If you don’t have these privileges, contact your administrator or get a free ArcGIS trial.
Find the Start Location on a Map
Step 1: Sign in to ArcGIS Online with your ArcGIS account and click Map.

Step 2: On the Settings (light) toolbar, click the Search icon, type your start address in the search bar that appears, and choose from the suggested addresses.
The map displays a pop-up with your search result.

Step 3: At the bottom of the search result pop-up, click Add to new sketch.

A new sketch layer is added to the map.
A layer is a logical collection of geographic data—for example, roads, rivers, or boundaries such as ZIP codes. When you create a map, you can combine many layers. For this map, the new layer that you created contains one data point: your chosen address.
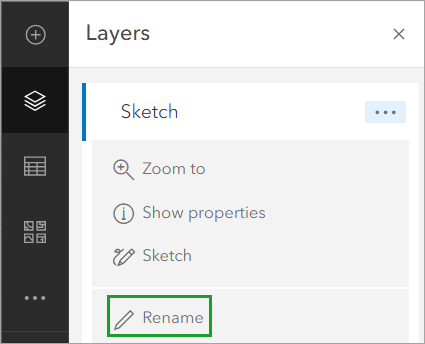
Step 4: From the Contents (dark) toolbar, click Layers, click Rename, and rename Sketch to something more specific. For this tip, rename your layer “Home.”
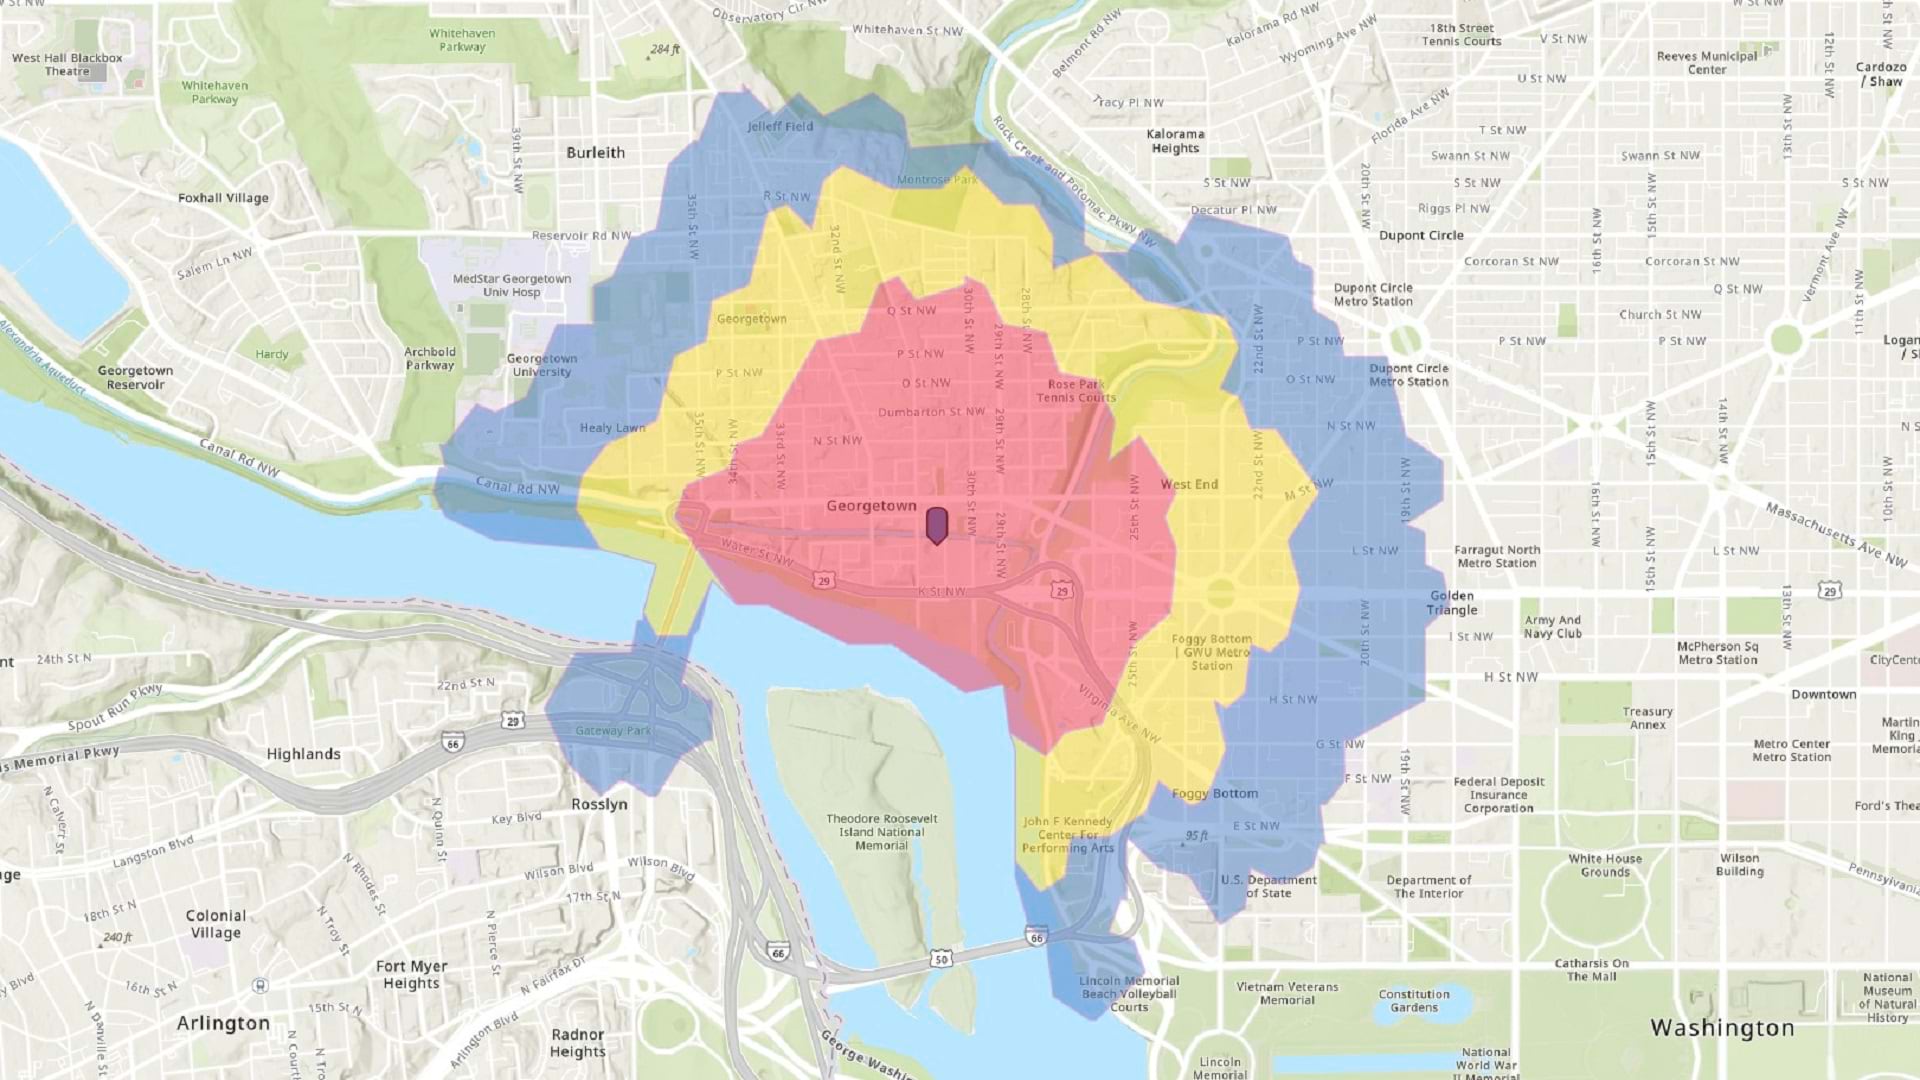
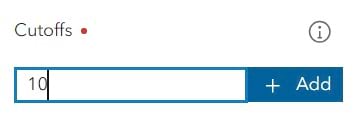
For this tip, you will create three walking areas: 10 minutes, 15 minutes, and 20 minutes.
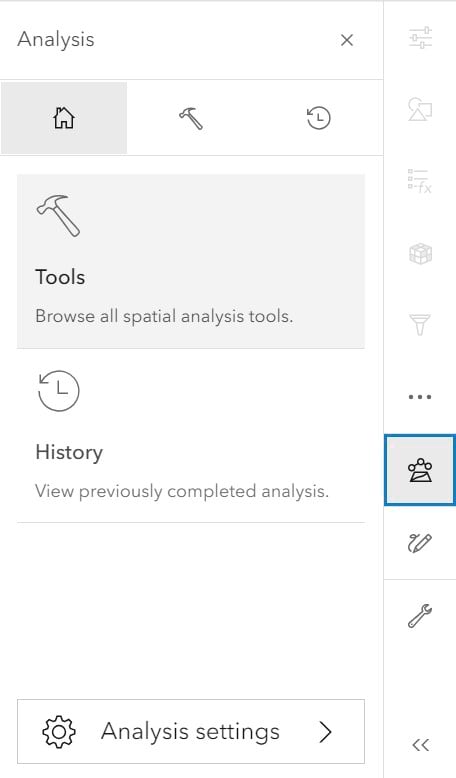
Step 5: From the Settings toolbar, click Analysis, then click Tools.
Step 6: Type “walk time” in the search bar, and click Generate Travel Areas.

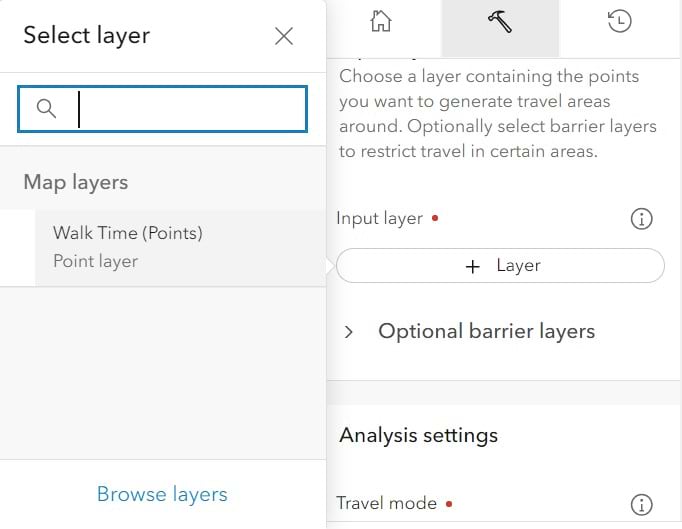
Step 7: For Input layer, click Layer and choose Home.
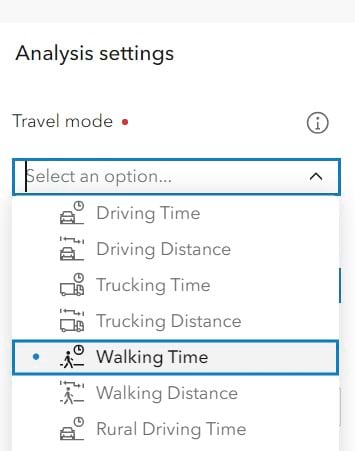
Step 8: For Travel mode, choose Walking Time.
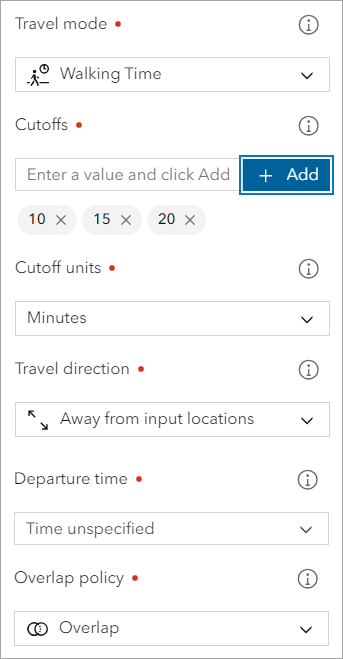
Step 9: For Cutoffs, type 10 and click Add. Repeat, typing 15 and then 20.
Step 10: For Cutoff units, choose Minutes.

Step 11: For Travel direction, Departure time, and Overlap policy, keep the defaults.
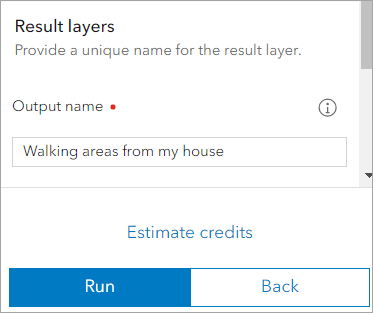
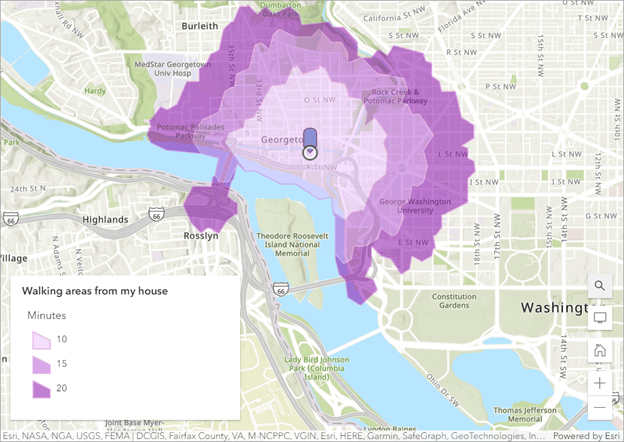
Step 12: Type a unique name for your output layer (such as “Walking areas from my house,” if starting from your home address). Click Run.
When the analysis is done, your walk areas appear on the map and a new layer appears in the Layers list.
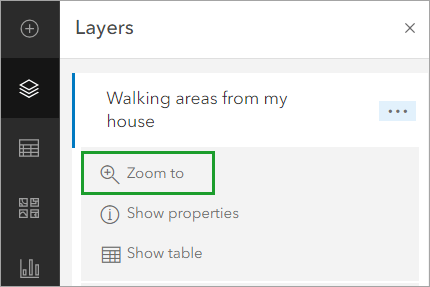
Step 13: From the Contents toolbar, click Layers, click options next to your travel area layer name, and click Zoom to.
Now you can see all the areas that are walkable from your starting point in 10-, 15-, and 20-minute increments.
Apply a Smart Mapping Style
You can change the default colors for the travel areas. Use smart mapping to apply a different style to the travel area layer.
Step 1: Click Show properties from your travel area layer options.

Step 2: On the Settings toolbar, at the bottom of the Symbology section (where you see your walking areas), click Edit layer style.

Step 3: In the Styles pane, scroll to Types (unique symbols), and click Style options.

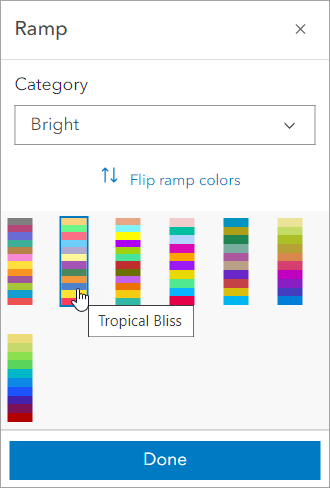
Step 4: Click the Symbol style color ramp to change colors.

Step 5: Click fill color, choose a ramp category, and choose a color ramp. From the Category drop-down menu, you can filter color ramps based on your needs and preferences.
You can use this walk-time map to plan your route from a given point.

More Information
- Create sketch layers (help topic)
- Analysis Basics (video)
- Generate Travel Areas (help topic)
- Apply styles (help topic)
- Get started with ArcGIS Online (tutorial)