The City of Memphis Public Works Division inspects and maintains approximately 150 miles of concrete channel lining (CCL) used for rainwater drainage in the city of over 600,000 residents. Without this care, CCL ditches would not adequately drain stormwater from the system—which could result in floods and ditch overflows.
“Much of this system was installed at least 50 years ago and is reaching the end of its service life,” said Evan Boulanger, City of Memphis stormwater design engineer manager. “Also, these channels could be a detriment to flooding or the environment in certain situations.”
To inspect CCL ditches, the drain maintenance department has historically used a disconnected paper-based system for tracking ditch inspections and related maintenance problems. These paper records were not connected to any database and were frequently lost or damaged, resulting in poor data quality, missed repairs, and an inability to make informed or timely decisions.
“These issues prevented the department from having an accurate picture of the current state and condition of our CCL ditch system, which, in turn, led to maintenance issues, exacerbating flooding and customer complaints,” said City of Memphis drain maintenance manager Corey Lewis.
Without an accurate inventory and a view of the condition of the stormwater pipes and ditches, the City of Memphis was forced to make difficult scheduling and maintenance decisions based on incomplete or missing data.
To remedy this, the City of Memphis partnered with Allworld Project Management to develop a solution with ArcGIS Enterprise portal to assist the drain maintenance department with CCL inspections, maintenance, and planning. The portal draws on the full ArcGIS suite, including ArcGIS Field Maps, ArcGIS Dashboards, and ArcGIS Pro, to ensure that the city’s new, robust inspection system allows the drain maintenance department to track and make decisions with a reliable set of data.
Inspecting the Data
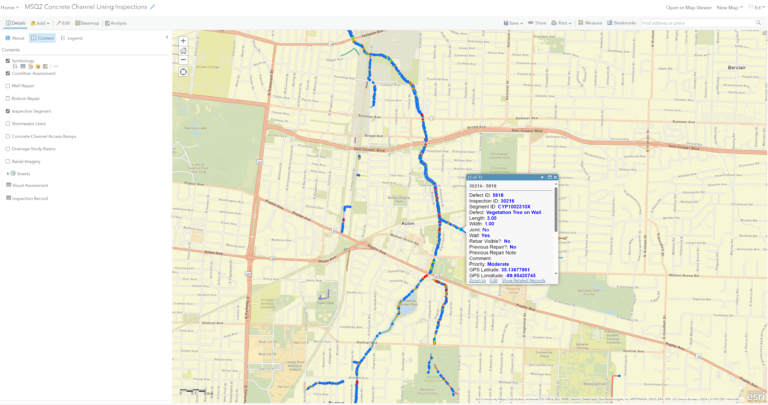
Because the drain maintenance department already used an ArcGIS system for asset management, it was relatively simple to identify the existing CCL infrastructure that required inspection. The CCL segments were queried and divided into segments that ran between landmarks such as bridges, street crossings, or major intersections. Once loaded into databases and published into Representational State Transfer (REST) services, a series of web applications, field maps, dashboards, and reports were created to manage the inspection program.
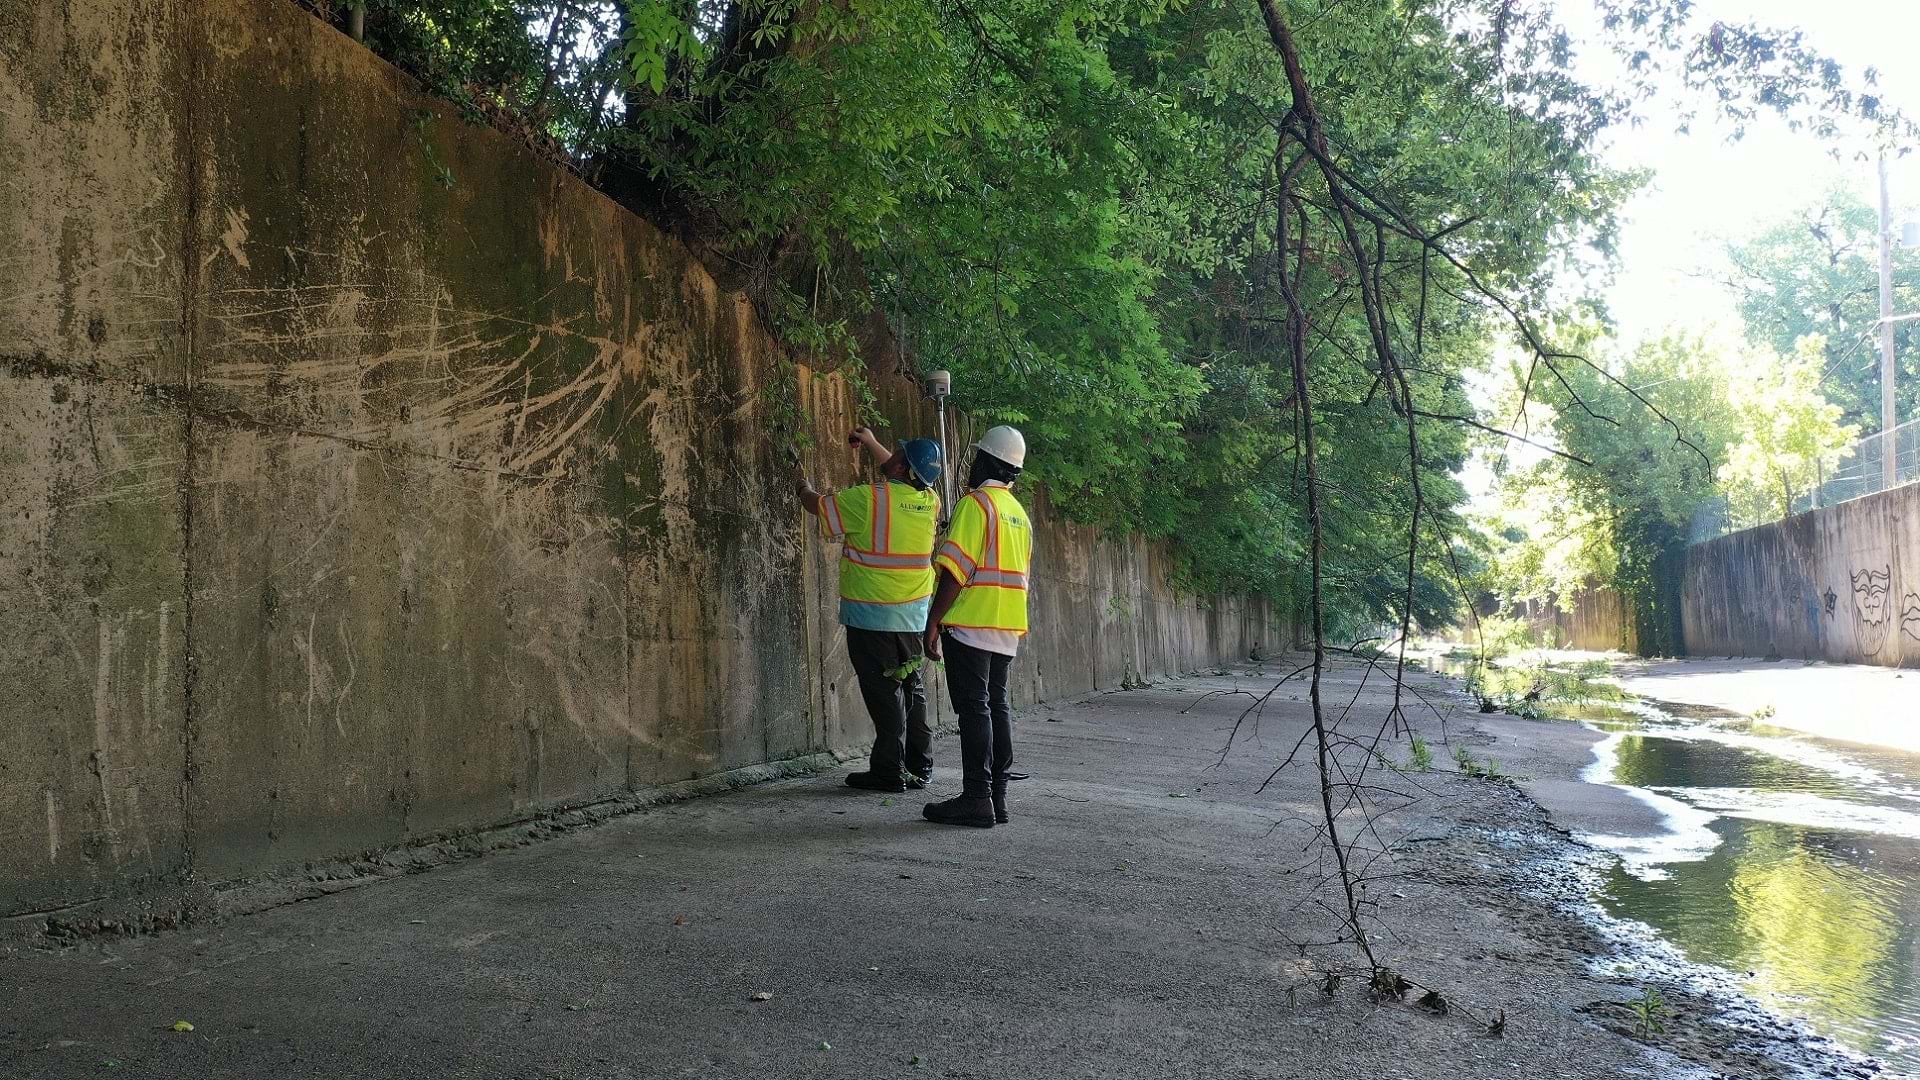
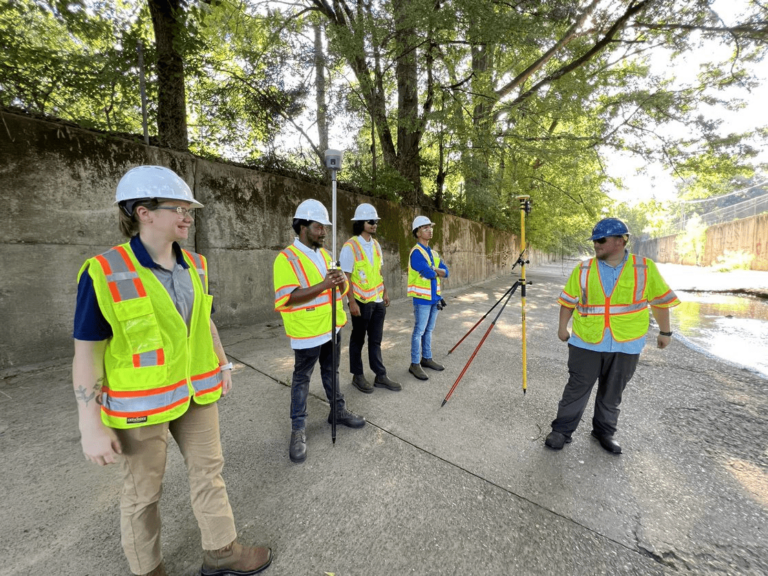
To collect data, crews use ArcGIS Field Maps to locate segments required for inspection. A field crew can select the CCL segment being inspected and access related data such as weather conditions and which inspector conducted the assessment. Once completed, the crews record the defects while walking the CCL ditch, including cavities, scouring, and root penetration, assigning severity ratings for prioritization. Crews can also assess the ditch walls and bottoms by drawing polygon boundaries around problem areas.
One advantage of using ArcGIS Field Maps is that certain fields can be set as required, ensuring critical data entries are not missed. This and other customizations vastly streamline the data collection process and allow for a simple, accurate user experience.
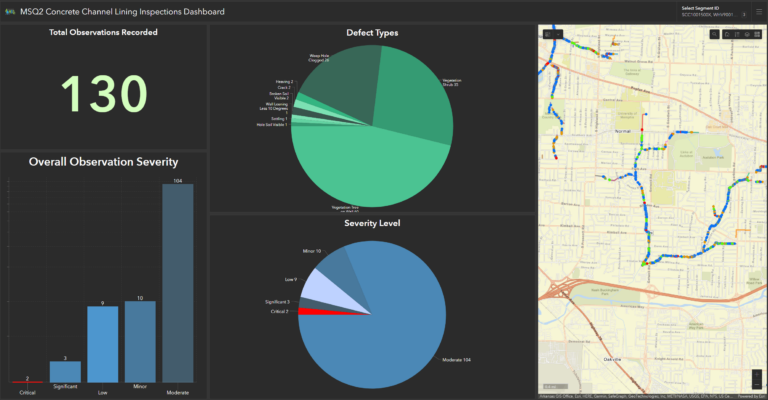
A dashboard was created with ArcGIS Dashboards for management to track inspection progress along with a detailed breakdown of defects grouped by the inspection segment. With this, management can see the number, type, and severity of defects found in each line segment. This data can help gauge the overall health of the line and likelihood for failure, allowing for more accurate budgeting and planning as resources can be devoted to the areas with highest severity.
In addition to the assessment data, the administration can track project progress on a daily, weekly, monthly, and quarterly basis. Project data is updated in real time, giving a more robust and accurate view of the status of the project and any scheduling areas of concern.
“As we review our stormwater system, we can incorporate data from condition assessments, allowing us to better justify projects where the infrastructure is nearing the end of its life cycle and increase the level of service in those areas,” said Christopher Harper, City of Memphis drain maintenance engineer. “Dashboards allow us to view all of this data in one place and highlight key issues.”
With the built-in report generator in ArcGIS Pro, a custom PDF generator was also created to show users each defect located during a segment inspection along with pictures, graphs, charts, and centimeter-level GPS coordinates.
Getting Results
Modern GIS tools such as customized applications for field collection, office administration review, and report generation have given Memphis Public Works the tools to identify areas where large failures will require full rehabilitation and where preventative maintenance work could reduce immediate flooding concerns due to CCL ditch overflows. Moreover, the city has finally been able to introduce a program of preventative CCL maintenance to address problem areas before they become larger and more expensive issues.
“When wall failures occur along the channel-lined ditch, not only are upstream flood risks increased, but adjacent properties are threatened,” said Harper. “Identifying issues before a failure occurs allows us to forecast asset renewals and mitigate failures by addressing these problems with less invasive and less expensive repair methods than full wall replacements.”
With real-time data analysis and reporting, city administrators can now efficiently schedule and plan future improvements and conduct infrastructure maintenance based on data-driven analytics fed by real-time data. This approach leads to savings in both labor and material. Work duplication has been drastically reduced. Projects can be scheduled between multiple departments and assigned based on areas with the highest need and return on investment.
“Having this system mapped within GIS has been very helpful, especially when it comes to assessing current conditions, accessing existing design plans, and correlating these condition assessments with existing calls in the city’s 311 service request system,” said Boulanger. “This helps us prioritize the repairs of concrete-lined channels, as well as areas that might benefit from the removal of some concrete-lined channels where they could be a detriment to flooding or the environment.”