Williams, one of the largest natural gas pipeline companies in the United States, began using ArcGIS Monitor in 2018 to keep an eye on the company’s enterprise GIS resource utilization, service usage, and performance.
With major offices in Utah, Texas, and Pennsylvania, as well as its headquarters in Tulsa, Oklahoma, Williams has natural gas storage facilities and pipelines that stretch from coast to coast. Therefore, the company relies heavily on GIS to maintain and manage its network of pipelines and other assets across vast distances, taking advantage of over 60 development, quality assurance (QA), and production servers and an enterprise portal that accommodates nearly 4,000 users.
With such a massive, complex GIS environment, it’s easy to see why the company turned to ArcGIS Monitor, which remotely monitors enterprise GIS and IT infrastructure, providing GIS managers and teams with usage and performance information. Given the organization’s size, troubleshooting technical issues—including malfunctioning web maps, broken links, and underpowered services—has always been difficult and time-consuming. ArcGIS Monitor, which also detects existing and potential problems in databases and GIS services, has streamlined troubleshooting that previously took several hours or days. On top of this, it enables Williams staff to view reports and metrics, which improves communication between GIS and IT staff and senior management.
In 2023, ArcGIS Monitor underwent an overhaul to improve and expand the program’s capabilities, including a redesigned user interface and more flexible display of performance metrics. And as one of the early adopters of ArcGIS Monitor 2023, Williams has been fully leveraging many of its new and improved features.
An Invaluable Resource
“When we first started using Monitor, it was to see how much our resources were being used by map services,” said Steve McCarthy, a systems architect at Williams. “We have a pretty elaborate [ArcGIS] Enterprise system here, so we have to make sure our servers aren’t running out of RAM, CPU, or disk space.”
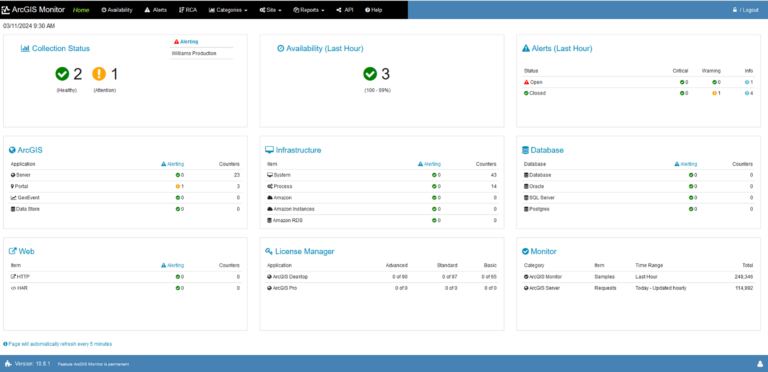
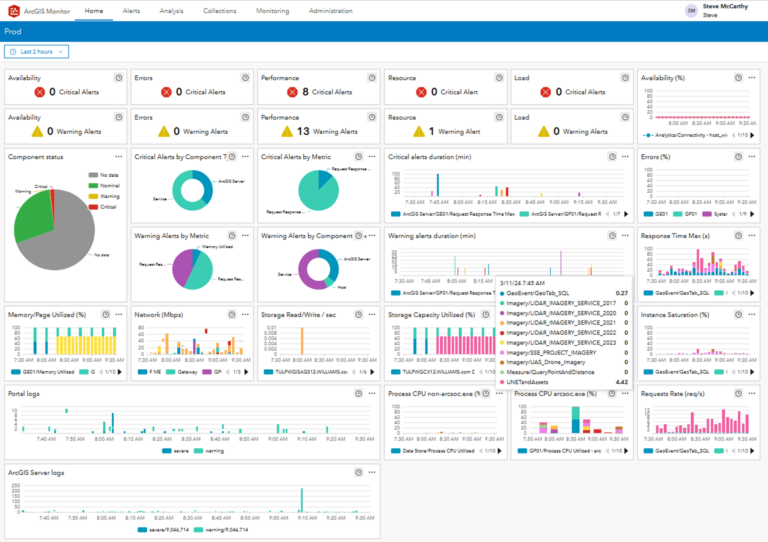
In the event of any performance issue, the process of creating a ticket and fixing the issue now takes a matter of minutes. But Williams also uses the alerts function in ArcGIS Monitor to prevent issues before they happen.
“We had an issue with the hosting server a while back where if it got to 100 percent [system resource utilization] and stayed there for 15, 30 minutes, we knew there was a problem with our hosting server,” said McCarthy “We set an alert up on that and we knew that we could fix it quickly instead of it being a complete outage for hours on end.”
ArcGIS Monitor also displays performance information that makes it easier to ensure that everything is working as expected after patches and upgrades are applied. And the accessibility of performance data comes in handy whenever Williams considers adding services to its GIS and IT infrastructure.
“I can look at Monitor right away and within a few minutes get the answer on where we want to put [those] services,” noted McCarthy.
Since the original 2018 implementation, Williams’ use of ArcGIS Monitor has increased as ArcGIS Monitor has undergone regular updates and McCarthy and other Williams team members have grown more comfortable with it. The software is now an integral and constantly referenced resource for the company’s GIS and IT staff.
Monitoring the Future
With the release of ArcGIS Monitor 2023, Williams has been able to take advantage of a whole new suite of features.
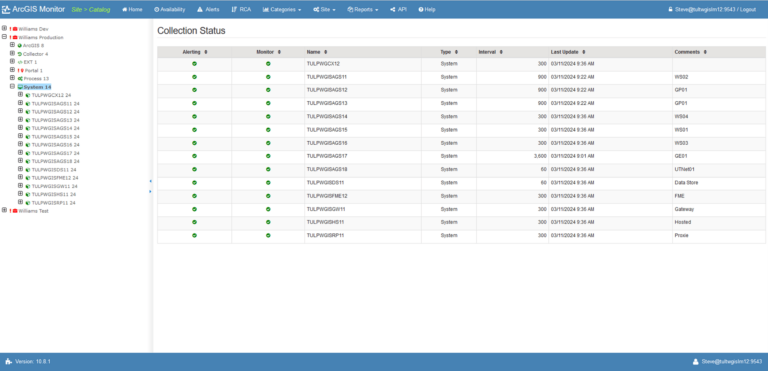
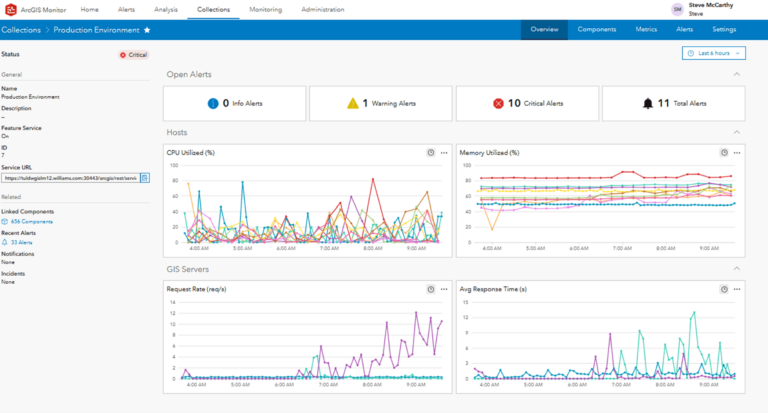
“It’s kind of like going from DOS to Windows,” said McCarthy, referring to the family of disk-based operating systems introduced in the 1980s.
Of the new additions to ArcGIS Monitor, Williams has benefited the most from its updated interface. For one thing, the flexibility of the data metrics displayed has made it much easier to spot and understand issues that may need troubleshooting without too much investigative work.
“That’s one of the cool things about the new Monitor,” said McCarthy. “You can drill all the way down to find what’s going on in the [server] logs. With the old Monitor I could see what was going on, but I’d go into the server manager and dig into the logs. [Now] I don’t have to do that as much.”
The other major benefit of the interface update has been the ease of communicating performance data to colleagues and supervisors within Williams. Dashboards with clear visuals and easy-to-interpret charts enable staff who are less familiar with ArcGIS Monitor to more easily read metrics displays and take action to fix potential issues. Moreover, McCarthy and other Williams IT staff can give supervisors a better understanding of both overall system health and individual problems that may occur.
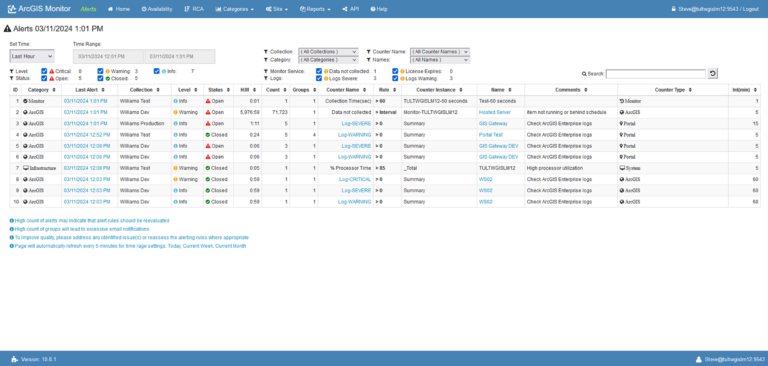
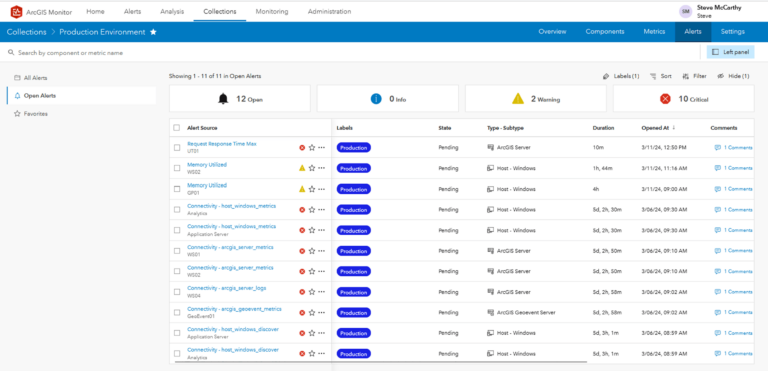
“It’s really easy to explain,” said McCarthy. “If we do a root cause analysis on an outage, I can go back and say, ‘This is what caused it and this is why it affected all these users.’”
Williams has also taken advantage of ArcGIS Monitor 2023 updates’ ability to automatically coordinate with other services such as portals and GIS servers, as well as new labeling components.
“When you add an ArcGIS server with the new Monitor, it sees all the services in there,” said McCarthy. “I don’t have to add all the services. Then I have the ability to label my prod[uction] environment versus my test environment [or my] dev[elopment] environment.”
Through these updates and changes, McCarthy and other Williams staff have been quick to see the value of each update and fold it into their daily workflows, further streamlining many of the activities that ArcGIS Monitor helped them improve when they first implemented it.
“First I was using 75 percent the old Monitor, 25 percent the new Monitor,” said McCarthy. “Every month or so [my usage] probably goes toward the new Monitor by 10 percent. It’s going to be an information source for more people in the company as it matures.”

