For this tip, you’ll learn how to add a .csv file to a map in ArcGIS Online and then join it to a feature layer. You’ll learn about the Join Features tool, including the difference between inner joins and left joins and how to summarize matching records.
To get started, you’ll use data stored in a table to display the data on a map. The table shows the number of primary health centers (PHCs) in each state or union territory in India. PHCs are small clinics found across India.
The data is nonspatial, so it can’t be shown on a map, but it can be joined to a feature layer that maps the boundaries of states and union territories. This operation will create a new feature layer that shows the number of PHCs across India.
You’ll need an ArcGIS Online organizational account with a Publisher, Facilitator, or Administrator role (see options for software access).
Step 1. Add a .csv file to a web map
First, you’ll open a map in ArcGIS Online and review a feature layer of states and union territories in India. Then you’ll download a .csv file of PHCs and add it to the map as a table layer.
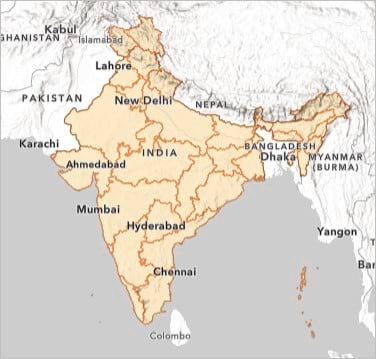
Click on this web map link: India States and Union Territories, then sign in to your ArcGIS Online account if necessary. A map of India appears.
On the Contents (dark) toolbar, click the Layers button.
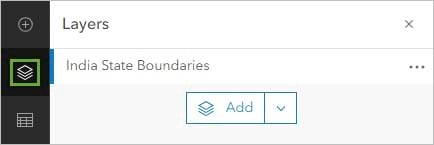
The Layers pane appears. The map has one feature layer—India State Boundaries. Feature layers can have spatial information (in this case, the shapes and locations of the states that are visible on the map) and tabular information (in this case, an attribute table).
Next, you’ll add a .csv file as a table layer. Table layers are nonspatial: They only contain tabular information.
Click on this link—PHCs.csv—to download a file that contains information about the number of PHCs in urban and rural areas in India. Make a note of where the file is now stored on your computer.
In the Layers pane, next to Add, click the drop-down arrow. Click Add layer from file.
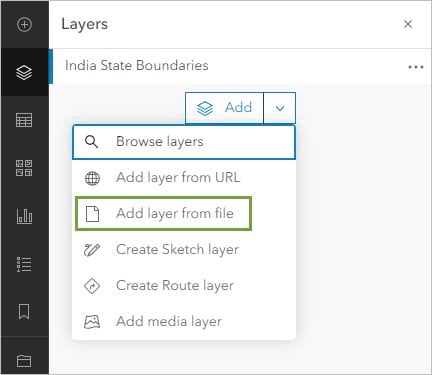
Drag the PHCs.csv file to the Add Layer window. Make sure that “Create a hosted feature layer and add it to the map” is selected, then click Next.
Five fields are listed. They match the column headers in the .csv file.
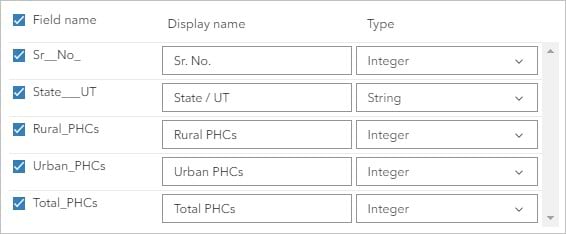
Click Next.
The page that appears gives you the option to define locations for the data using addresses or place names. You will add your data as a nonspatial table layer instead.
For Location settings, confirm that None is selected. (You could choose Addresses or place names and use the State / UT field to geocode your data, but this method would create a point layer. For your map, you need a polygon layer with the states’ boundaries. Learn how to geocode a table in the tutorial Convert a list of historic places into a map.)
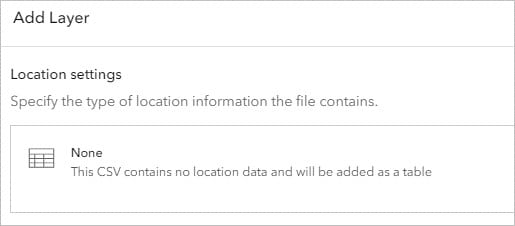
Click Next.
On the page that appears, in the text box under “Title,” enter “PHCs,” followed by your name or initials (for example, PHCs Your Name).
For Summary, enter “Rural and urban primary health centers (PHCs) in each state or union territory in India,” then click Create and add to map. The map of India reappears.
On the Contents toolbar, click the Tables button. The PHCs table is listed in the Tables pane.
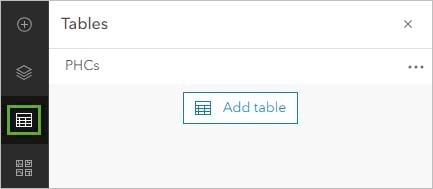
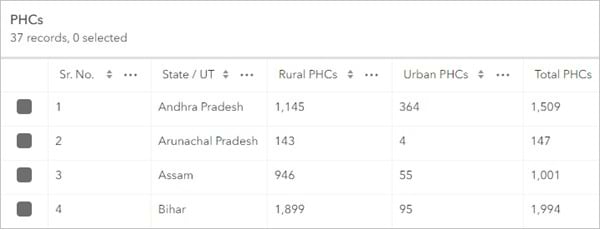
In the Tables pane, click the PHCs line to open the table. Review the table’s contents to confirm that the data was imported correctly. It should have five fields (columns) and 37 records (rows).
Step 2. Join a table to a feature layer
Next, you will join the table layer to the feature layer using the Join Features analysis tool. The result will be a new feature layer with the same shapes as the India State Boundaries layer and the same attributes as both the India State Boundaries and PHCs layers.
You’ll start by finding a common field shared by both layers. You’ll use this to link the correct rows in the table layer to the correct features in the feature layer.
Click any orange area on the map. A pop-up appears, listing the layer’s fields. The Name field contains the name of each state or union territory. This field matches the State / UT field in the PHCs table.
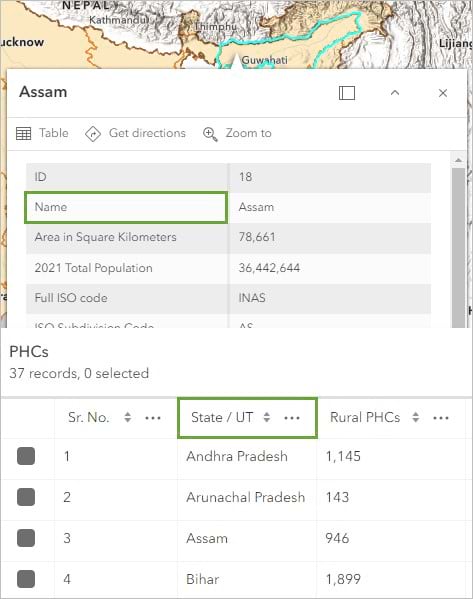
Next, you’ll use the Name and State / UT fields to join the two layers.
Close the pop-up and the table.
Next, you’ll open the Join Features analysis tool.
On the Settings (light) toolbar, click the Analysis button. (If you do not see the Analysis button in Map Viewer, contact your ArcGIS administrator. You may not have the privileges required to perform analysis.)
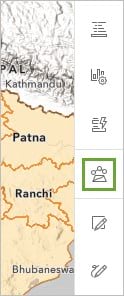
In the Analysis pane, click Tools.
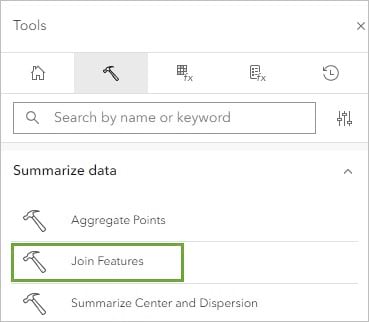
Under Summarize data, click Join Features.
For Target layer, click Layer and choose India State Boundaries. This is the layer that will receive the joined fields. For Join layer, choose PHCs. This is the layer that will provide the joined fields.
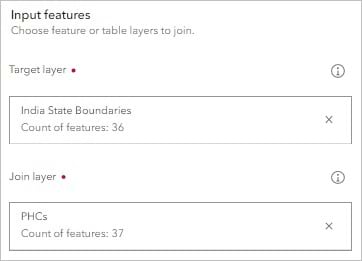
For Join settings, set the following parameters:
- Ensure that Use attribute relationship is enabled.
- For Target field, choose Name.
- For Join field, choose State / UT.
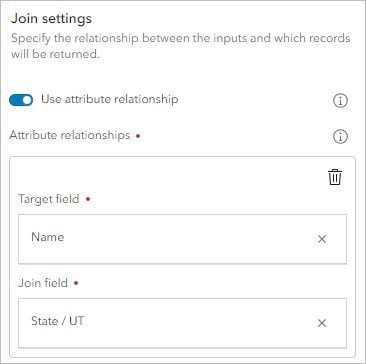
The join operation will only be able to join records in which the Name and State / UT attributes match.
Ensure that the following parameters are set:
- For Join operation, ensure that Join one to one is selected.
- For Multiple matching records, ensure that Only keep first matching record is selected.
- For Join type, ensure that Inner join is selected.
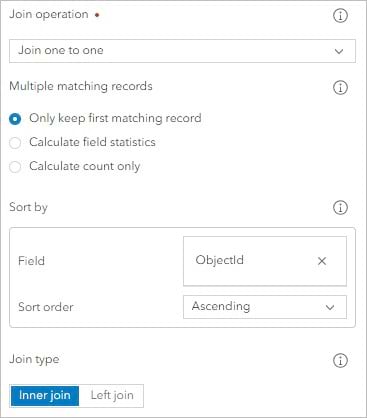
When Join type is set to Inner join, any features that do not match will be missing from the new layer. This will make it easier to find out whether the join operation was successful.
For Output name, type PHCs Join, followed by your name or initials, then click Estimate credits.
The join operation will use 0.073 credits. The number of credits is based on the number of features.

Click Run.
At the top of the Join Features pane, click the History button. The tool’s status is shown here.
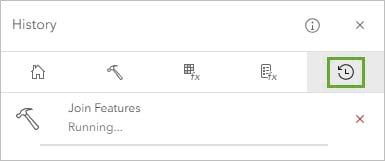
When the tool completes running, the output appears on the map.
Step 3. Edit the table
Three features are missing from the map. You’ll review these missing features, then you’ll find these states or union territories in the PHCs table to learn why they did not join with the feature layer. You’ll edit the table layer to make it match the feature layer so the two can join correctly.
On the map, click each orange area to find the name of the state or union territory that did not join. Zoom in if necessary to spot all of them.
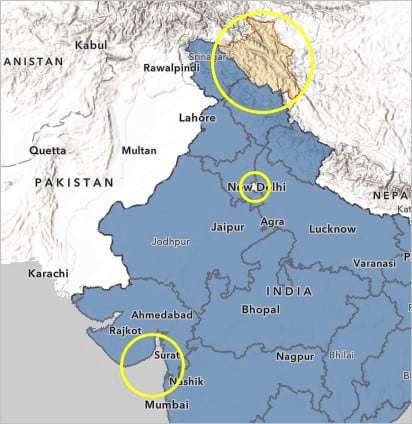
There are three missing features: Ladakh, NCT of Delhi (National Capital Territory of Delhi), and Dadra & Nagar Haveli & Daman & Diu (on the west coast, near the city of Nashik).
These features likely failed to join because they were spelled differently in the two layers.
Close the pop-up.
In the Tables pane, click PHCs to open the table, then scroll down to row 34, where the State / UT name is labeled Delhi.
In the State / UT column, the spelling on row 34 needs to change before this record can join successfully. You don’t have editing privileges on the feature layer, so you’ll edit the table layer.
In the table, double-click Delhi and type “NCT of Delhi”. Press Enter.
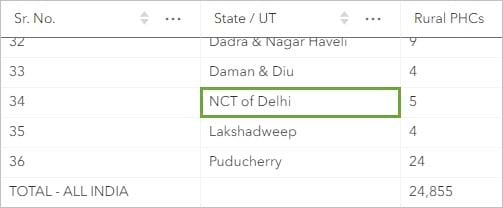
Rows 32 and 33 are the union territories of Dadra & Nagar Haveli and Daman & Diu.

These two union territories were merged in 2020, which explains why there are two records in the table layer and only one in the feature layer.
In rows 32 and 33, in the State / UT column, select the text and change it to read “Dadra & Nagar Haveli & Daman & Diu”.
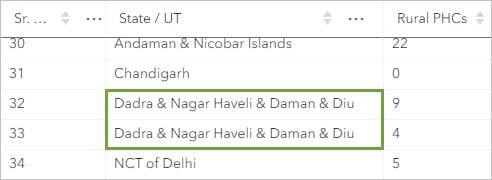
In the joined output, you need the numeric values from rows 32 and 33 to be added together to create the new PHC numbers for Dadra & Nagar Haveli & Daman & Diu. The expected new values are 13 (Rural PHCs), 2 (Urban PHCs) and 15 (Total PHCs). There is no need to edit the Rural PHCs, Urban PHCs, and Total PHCs fields. The Join Features tool can summarize them for you.
On the table’s header, to the right of State / UT, click the Options button and click Sort ascending.
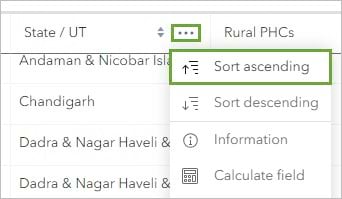
Scroll through the alphabetized table to look for a row for Ladakh. You will see that this row is missing, as no PHC data is available for Ladakh.
Close the table.
Step 4. Run the join again
Now you’ll run the Join Features tool again with the edited table layer. You’ll change two of the tool’s parameters—Multiple matching records and Join type.
In the History pane, next to Join Features, click the options button and click Open tool.
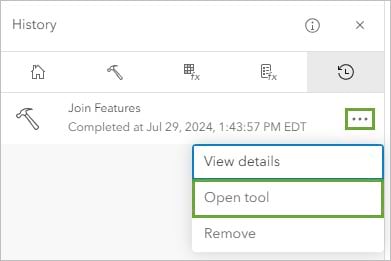
The Join features tool reappears. The parameters are already set with the choices you made earlier.
Scroll down the pane. For Multiple matching records, choose Calculate field statistics.
The table layer now has two records that will match to the same feature: Dadra & Nagar Haveli & Daman & Diu. Instead of just matching the first record, you want to summarize the numeric values from both records.
Next, you’ll indicate in the tool which fields to summarize and how.
For Field statistics, click the Field button.
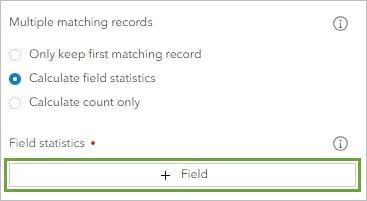
In the Add field window, select all three fields (Rural PHCs, Total PHCs, and Urban PHCs) and click Done.
The three fields are added to the Join Features pane.
Ensure that on each field card, Sum is selected.
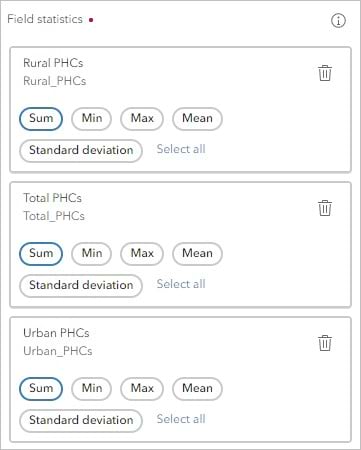
Now that the state names all match, you’ll change the Join type. Last time, you only wanted to keep matching records so you could see what was missing. This time, you will keep all records so Ladakh will still appear on the map, even though it has no PHC data.
Scroll down a little more. For Join type, choose Left join.

Under Result layer, for Output name, type “PHCs per state or union territory”, followed by your name or initials. (The tool will use 0.073 credits, the same number as last time.)
Click Run and wait for the process to complete.
On the Contents toolbar, click the Layers button.
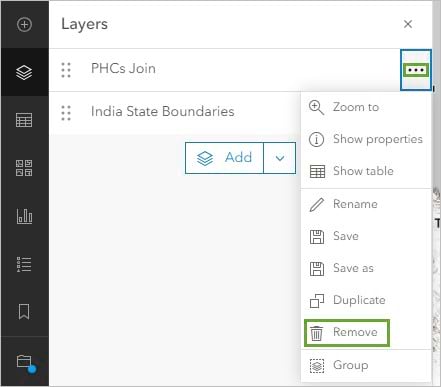
In the Layers pane, on the PHCs Join layer, click the Options button and then click Remove.
Zoom to and click Dadra & Nagar Haveli & Daman & Diu union territory, north of Mumbai.
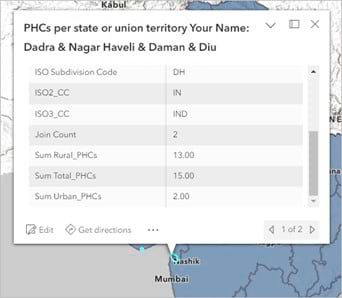
In the pop-up, the last three fields show the following values:

These are the correct values from adding the Dadra & Nagar Haveli and Daman & Diu values together.
Close the pop-ups and zoom out until you can see all of India.
Step 5. Style the map with the joined data
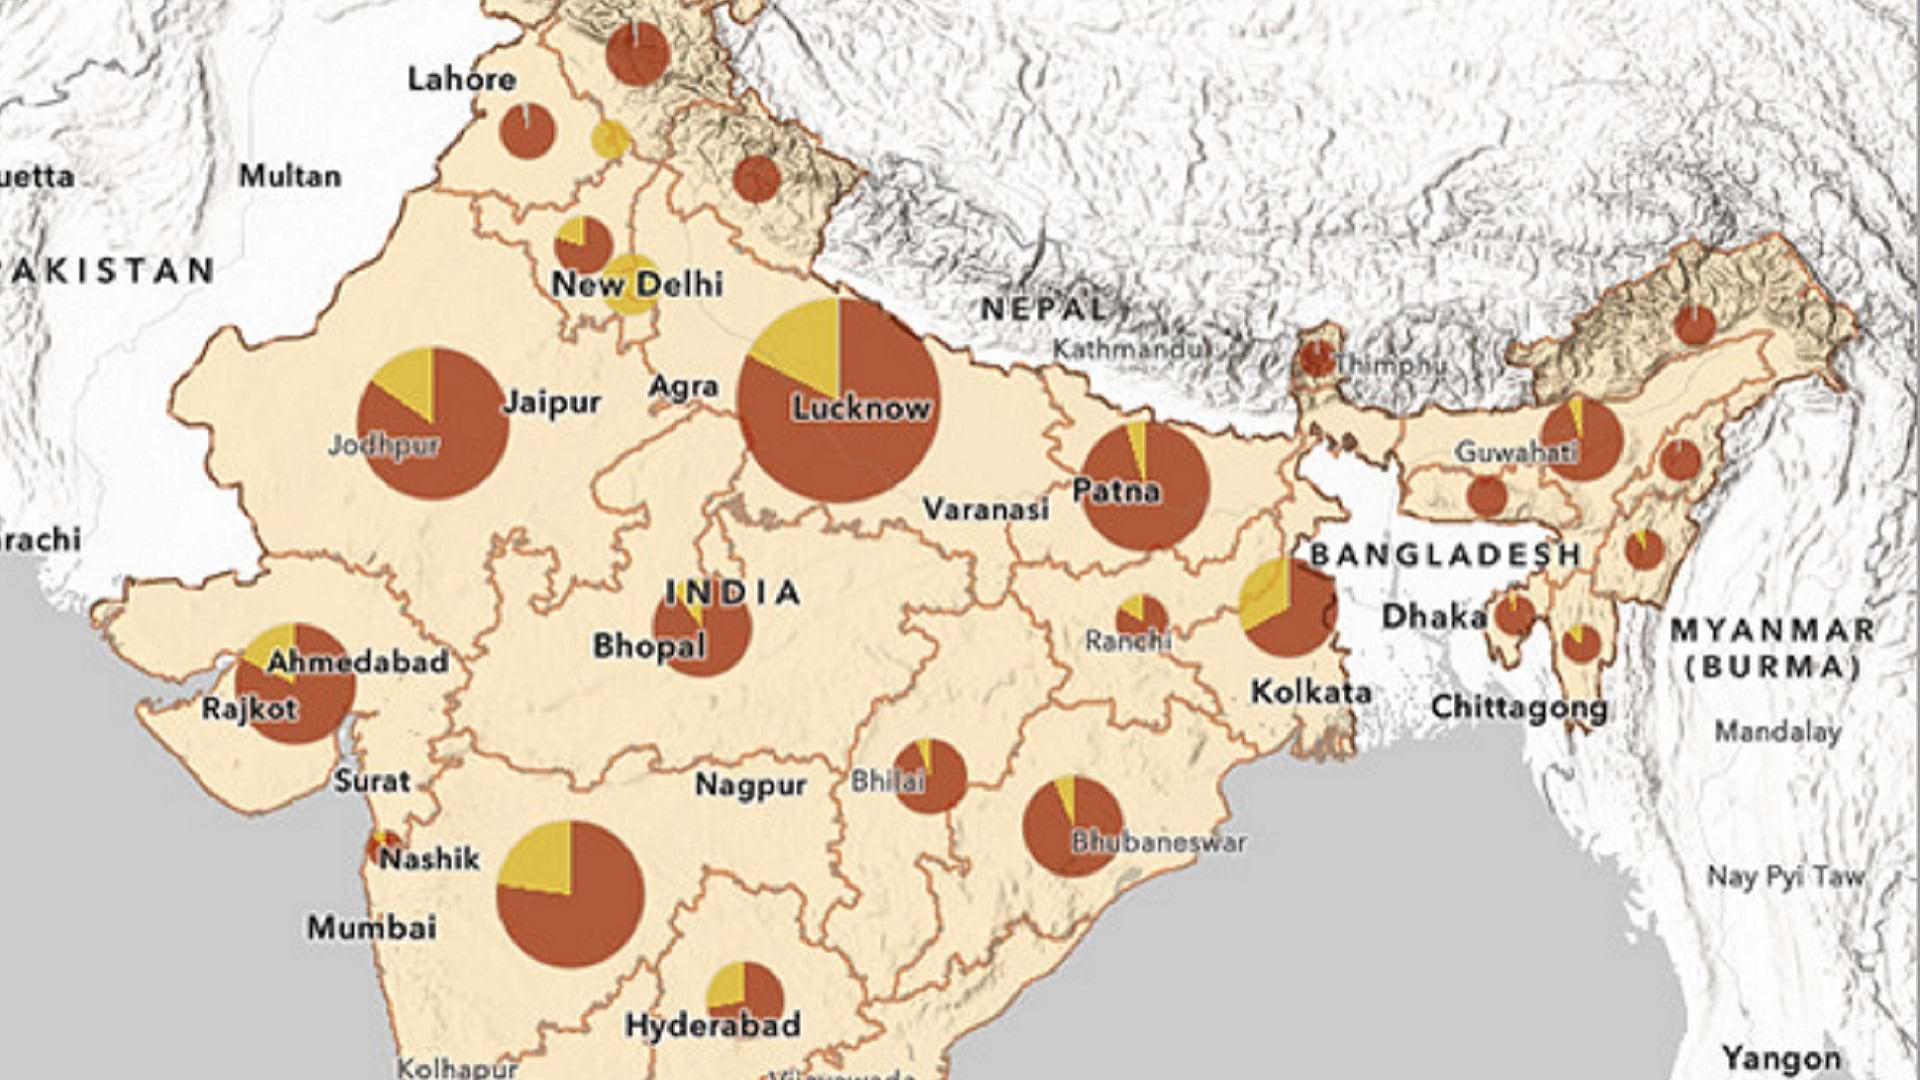
To finish, you’ll use the joined layer to visualize the PHC numbers on the map.
On the Settings toolbar, click the Styles button. (If the Styles button is unavailable, in the Layers pane, click PHCs per state or union territory. The Styles button is only available when a layer is selected.)
In the Styles pane, click the Field button.
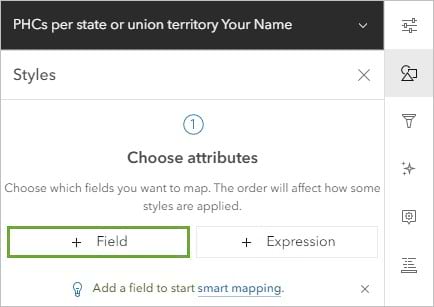
In the Add fields window, click Sum Rural_PHCs and Sum Urban_PHCs. Click Add.
For Pick a style, scroll down and click Charts and Size.
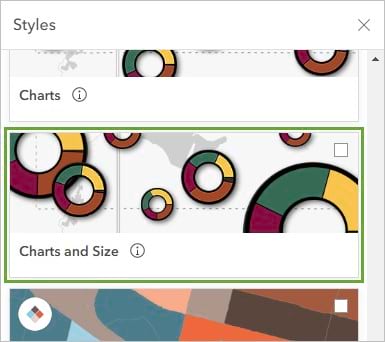
Click Done.
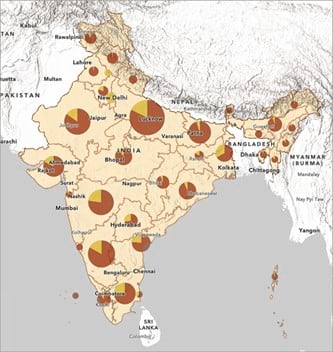
The data from the PHCs.csv table is now visualized on the map. With the exceptions of New Delhi and Chandigarh (north of New Delhi), all states and union territories have more rural PHCs than urban ones.
On the Content toolbar, click Save and open. Click Save as.
In the Save map window, for Title, type “PHCs per state or union territory”. For Summary, type “Rural and urban primary health centers (PHCs) in each state or union territory in India”.
Click Save.
The analysis history is now saved with the map. Later, you can review the parameters you used each time you ran the Join Features tool.
