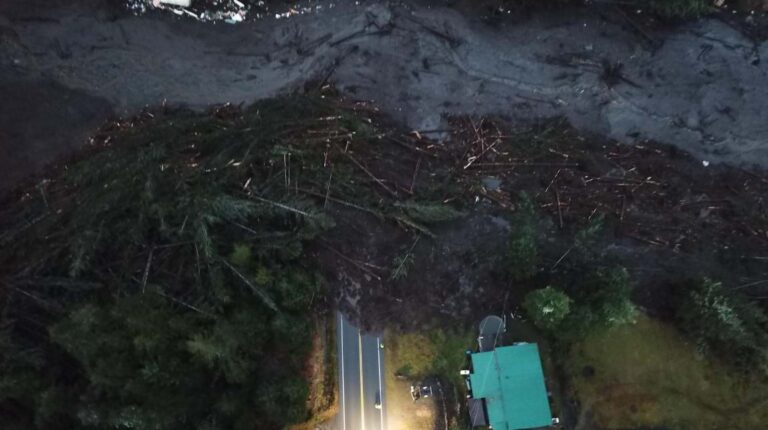
On November 20, 2023, heavy rainfall caused a landslide to descend onto the Zimovia Highway near Wrangell, Alaska, ultimately killing six people and forcing around 30 more to evacuate their homes. In the immediate aftermath of the disaster, however, several people were still unaccounted for. Search and rescue operations kicked off immediately.
“Materials Section staff were some of the first people on the ground responding to the Wrangell landslide, and they were there for weeks,” said Ellie Hakari, GIS analyst for the Southcoast Region (SR) Materials Section, a division of the Alaska Department of Transportation and Public Facilities (DOT&PF). “Some staff were there throughout the whole operation, and it just changed day to day, what we were doing, what we needed. We actively supported search and rescue operations, and then of course road repairs and disaster recovery.”
The Materials Section deals with all aspects of DOT&PF’s engineering and geospatial needs, from maintenance and operations to construction, acting as a kind of catch-all for engineering support throughout the agency. Because the group is increasingly using GIS technology for is operations, its staff is invaluable in emergency situations like the Wrangell disaster.

“When you get a call for a landslide, you need to have tools that are readily available, that are easy to use, [and] that can be used in different ways by different people,” said Mitchell McDonald, SR regional engineering geologist. “It’s important to have those tools identified, to know how to use them, because once that emergency starts, it’s chaos.”
Boots on the Ground—and in the Air
The first and most critical technological tool employed in response to the Wrangell landslide was drone imagery. With drones in the air, Materials Section staff could assist search and rescue teams on the ground as well as incident command.
“When we responded, a state trooper pulled up to the garage door where [avalanche and geohazard specialist] Pat [Dryer]’s drone lab is and we completely filled the back of that thing with Pelican cases and drone equipment,” said McDonald. “It takes a lot of resources.”
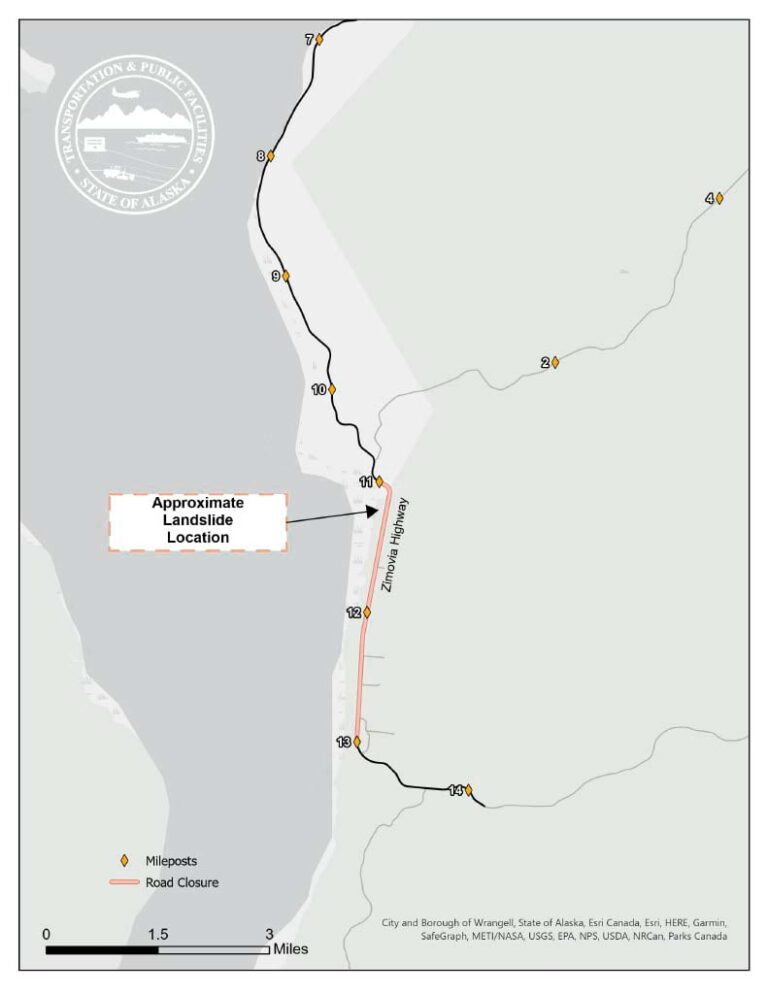
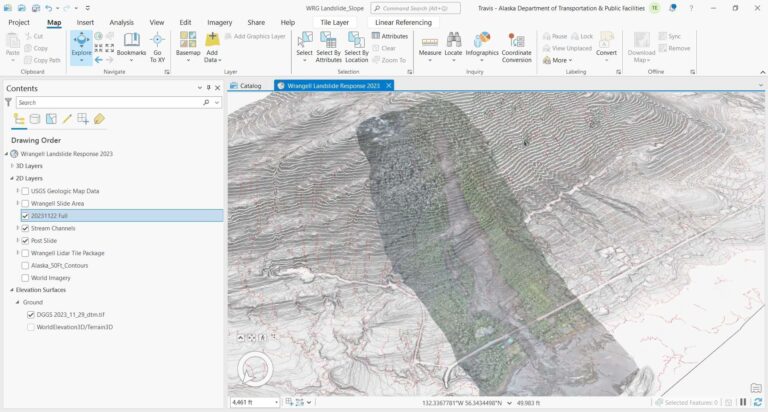
Back in the office, things were no less hectic. Hakari and David Oliver, SR GIS chief, were tasked with producing a map of the landslide for DOT&PF’s communications team to put out to the public. They built the map with ArcGIS Pro. Soon after, they were asked to analyze building footprints of homes in the direct path of the landslide, which were paired with drone imagery layers using Site Scan for ArcGIS and ArcGIS Online. This allowed the team to visualize the flow of debris and where homes may have ended up after the landslide.

ArcGIS Field Maps was also used to support search and rescue efforts, and Hakari created a story with ArcGIS StoryMaps where all this data could be accessed, including drone imagery.
Following active search and rescue efforts, the SR Materials Section had no time to rest after the shock of the disaster and their hard work in the immediate aftermath. There was more to be done—much more.
“Once you get through the initial emergency response, then you’re switching over to the recovery phase,” said Travis Eckhoff, SR regional materials engineer. “That’s where we start to look at, ‘OK, what do we need to do to get things back to their pre-disaster condition?’”
In practice, this meant taking stock of any repairs that might need to be done on roads or utilities, and whether any other infrastructure had been impacted that would need to be addressed. The first step was clearing the landslide itself.

“We also included [surveys created with ArcGIS] Survey123,” said Oliver. “Most of those were post-emergency response, to try and document the amount of material that was being disposed of or dealt with.”
In a landslide event that covers a larger geographical area, similar surveys might be done to track what happens to debris before and after a cleanup effort. The Wrangell event was fairly unique in that it was a single landslide that impacted a narrow area. In either case, tracking this information ensures that DOT&PF is reimbursed by the Federal Emergency Management Agency (FEMA) for disaster response efforts.
“It’s kind of the boring part that you don’t really talk about,” said McDonald. “[But] the only reason we can do what we do is because there’s funding available that starts with an emergency declaration. That’s the critical link for us, with GIS—our data collection center ultimately gets us that funding to do what we do and to continue monitoring.”

A Fresh Scar
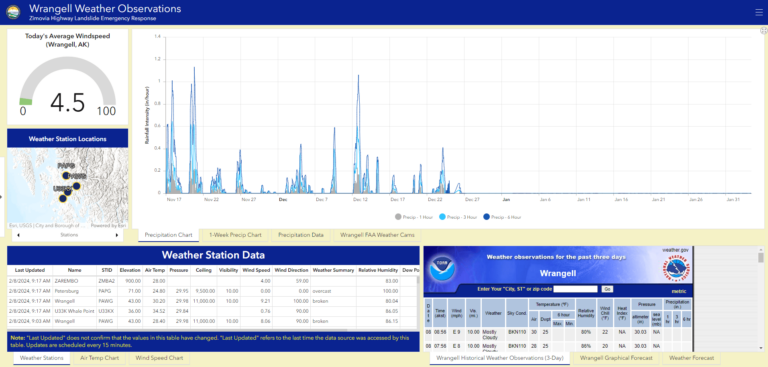
In the wake of an event like the Wrangell landslide, even once cleanup efforts are well underway, continual monitoring of the area is crucial. Where one landslide occurs, another could soon follow, and the Materials Section needed to be ready to sound the alarm if staff noticed any sign of instability or dire weather that could lead to it.
“We’re doing weekly flights and we’re looking for any changes that could impact our infrastructure within that landslide path,” said Eckhoff. “Are we seeing significant erosion? Are we seeing signs of additional slope movement?”
Between drone imagery and other GIS technology deployed to monitor the area and its weather, the Materials Section team could be the first to know about any further disaster.
“It’s a fresh scar,” said McDonald. “We don’t know what the ground is going to do now. It’s in a whole new configuration. But we’re also learning from it. Part of the problem with Alaska is that we’re data poor. So part of this monitoring is [asking], ‘OK, what’s happening on the slope after this has occurred?’”
With drone imagery augmented by data from weather stations installed in the area, the team can monitor whether the ground is reacting in similar ways to other peak weather events, or whether it has stabilized in the time since the landslide. With more monitoring equipment in place, the Materials Section can not only more thoroughly document damage done in the event of a disaster, but also better prepare for future events.

“We can now do routine [drone] monitoring that’s daily or weekly following storm events, snowfall events, and wind events,” said Dryer.
But being able to collect all this data is one thing—communicating and using it is another. As the Materials Section learns from their experience responding to the Wrangell landslide, they hope to make big strides in both of these areas.
“The ability to use these tools for not just data collection, but data sharing, would be great in the future,” said McDonald. “It would be great to integrate what we’re collecting in the field straight into FEMA databases.”
The team is also building a new geohazards program for the Southcoast Region—and hopefully for the entire state—that will use GIS tools such as ArcGIS StoryMaps and ArcGIS Hub to disseminate data and educate communities about landslide risks.
“But without David and Ellie heading up our GIS department, none of what we did would have been possible, regardless of what tools were available,” said McDonald. “We wouldn’t have been able to deploy them and use them. That’s one of the biggest takeaways: how important it is to have the capability to use all these tools. The analyst—that’s the most important GIS tool we used.”

