
In 1986, while Steve Jobs was creating a new workstation computer at NeXT and Dr. Leonard Bailey was pioneering infant heart transplants at Loma Linda University Medical Center, Brenda L. Carter was on the cusp of a new adventure: computer mapping.
At age 21, a close friend’s tragic death altered the course of Carter’s career plans to become a doctor. She and her friend had intended to go to medical school together after attending South Carolina State University, but Carter decided to put her studies on hold.
She took a job at Lexington County Planning Department in South Carolina, working as an addressing specialist for a new E-911 system. “[The county] needed an addressing person to assign addresses and help with road naming,” she said.
Carter’s interest in medicine was soon supplanted by computers, mapping, and planning. “I could read the maps very well, and I picked up everything they would teach me,” she said. “And that was simply because I was so interested in the [planning] field. I was like a sponge.”
So when Lexington County launched its first geographic information system (GIS) in December 1988, Carter was a natural to be selected for training in how to use the new GIS software, ARC/INFO 4.0 from Esri.
As a child, Carter loved nothing better than going down to a local lake or stream with a fishing rod in hand. She would bait her hook, cast out her line, and wait. “I loved to go fishing,” she said. “The worms didn’t bother me. My sister—that’s another story,” she said, laughing.
Working with ARC/INFO was just as sweet as watching her bobber slip below the water’s surface and then hauling in a fish.
“The minute that I started with that software, I was hooked,” said Carter, now 52 and the GIS manager for the Planning and Development Services Department (PDS) for Richland County, South Carolina. “It piqued my curiosity. The software helps you to provide important information in the decision-making process.”
The technology helped her determine, for example, where a fire station should be built to serve a community, including a new housing development.
“This was a scenario that I faced in the early 1990s, and GIS helped resolve the issue successfully using location allocation,” Carter recalled. “From that point forward, I had a new duty of finding the best locations for new fire stations in Lexington County.”
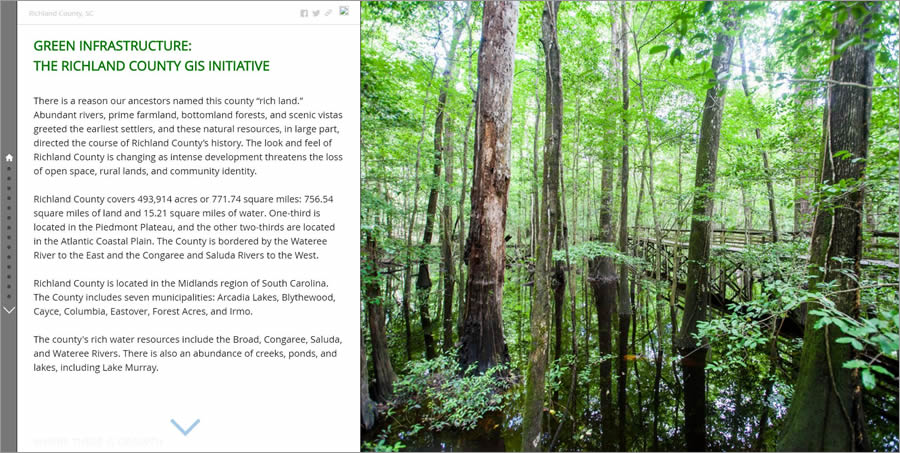
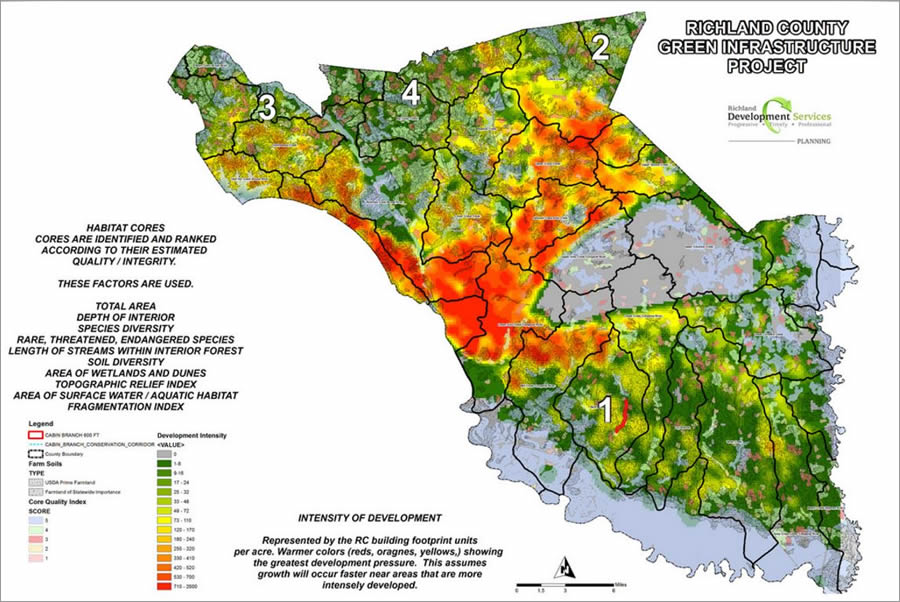
All these years later, Carter still gets important questions answered by using Esri software. In 2016, she used ArcGIS Desktop and the ArcGIS Spatial Analyst extension to analyze geographic, soil, species, and other types of data to create a green infrastructure plan for Richland County. (Read the story “Green Infrastructure Plan Fuels Smarter Growth in Richland County” in the Winter 2017 issue of ArcNews.) She then made the Esri Story Map Journal app Green Infrastructure: The Richland County GIS Initiative to summarize the project, which aims to protect environmentally sensitive areas of the county by using conservation easements to acquire land from property owners.
“Richland County is growing. It’s hustling and bustling,” said Carter. “[But] we do want smart development.”
AML Queen
Carter got a start in GIS in the early years of the computer mapping revolution. Esri released its first version of ARC/INFO, described in an Esri brochure as a software system for managing geographic information, in 1982. Lexington County adopted the software in 1989, just three years after Carter began doing addressing work. The county only had one problem.
“When we started, we had no geographical data. None. No layers,” Carter said. “We literally had to create the first basemaps. In order to do that, I had to learn how to code.”
Carter learned ARC Macro Language (AML), the scripting language that Esri created in 1986. With AML, she wrote scripts that would automate tasks and create custom applications in ARC/INFO. “This is old-school stuff,” she said.
How did Lexington County get its data for the basemaps? “We digitized our road centerline sheets over our [orthoimagery],” she said. “I wrote an AML [script] for everything we needed to do.”
Her colleagues were supportive, Carter said. “I worked with some great people,” she said. “My director at the time, Charlie Compton, allowed me all the time in the world to learn the software and read the manuals, so I knew what to do. Cheryl Matheny was there to bounce ideas off of, and my dear friend John Kludo taught me the finer things of AML coding.”
After the data edits were completed in ARC/INFO, the basemaps took shape. “Once they had digitized 567 individual maps, then I wrote an [AML script] that would bring each individual file, point, line, and polygon together,” Carter said. “Boom—we had [a] countywide road centerline layer, we had a countywide easement layer, and so on.”
Map production took off. “We printed out everything from subdivision maps [and] zoning maps to road centerline maps, easements, tax maps, and special project maps,” she said. “You name it; we printed it.”
Carter and her coworkers completed several projects, digitizing over 10,000 parcels before the County Assessor’s office contracted the project out.
By 1996, Carter was known as the AML queen of Lexington County. She even won that year’s AML shortcut contest, sponsored by Esri, for her entry, Freeze and Thaw. The Freeze and Thaw scripts prevented map production in ARC/INFO from being disrupted when staff shut down their computers at night.
“Back then, you had your backgrounds set, you had your colors set, and you had your tolerances set, and you needed to come back into that same atmosphere when you would come back in at 8:00 a.m.,” Carter said. “So I wrote these short pieces of code called Freeze and Thaw. If you typed ‘freeze,’ it would remember all your settings. When you came in the next morning and turned on your computer and typed ‘thaw,’ [the code] would bring all your settings back up and start you back [up] right where you were.”
Rural Roots
Today Carter is a certified GIS professional (GISP). She manages the small GIS and addressing team at PDS in Columbia, the county seat for Richland County. Her office is only about 34 miles from where she was raised, in Batesburg-Leesville, a close-knit community with a population of about 5,420 people.
Growing up in a family of eight, including four brothers and one sister, Carter said she was always interested in science and the outdoors. “My father liked fishing, and I loved to go too,” she said. “There was something relaxing about being on the water and waiting for the big one,” Carter said. “I loved that kind of thing.”
Her father also taught her about spatial awareness. He worked for a long time as a truck driver and always impressed upon his daughter the importance of being aware of her surroundings. “When I was younger, I didn’t read a map in the car. But when we would travel, my dad would always say, ‘Read the signs so when you go somewhere, you will know how to get back out.’ So I was always about location, location, location,” she said. “To this day, if I go somewhere once, I can go back again.”
Carter said she later received formal training in map reading in a Reserve Officer Training Corps (ROTC) class at South Carolina State University, which served her well when she applied to be an addressing specialist for Lexington County.
“One of the things you had to do during the interview was to find some locations on a tax map, so you had to be able to read a map.” she said. “I completed that part so fast; it was like a no-brainer for me, but I was told [that] many others couldn’t do it.”
Rich Land
Carter was hired as the GIS manager at Richland County PDS in 2000, moving just one county over from where she grew up. In the last 16 years, GIS technology has changed dramatically. ARC/INFO is long gone. So is AML.
While others might resist change, Carter is all for it. She said she always advocates for using the best and latest technology that will help the planning department do its job more efficiently. Recently she has been showing the department staff the advantages of Web GIS, including creating configurable apps using ArcGIS Online. She’s also planning to make more Esri Story Maps apps, which often are good tools for sharing information with government officials and the public.
“Story maps are easy to use because they help ordinary people visualize important data in an intuitive format,” Carter said. “Story maps provide a nongeographic dimension to the data. If I show you a map, you may soon forget what that was all about, but if I tell you a story, you are more likely to remember what the story was about. Telling stories about data is the way to grab and keep people’s attention.”
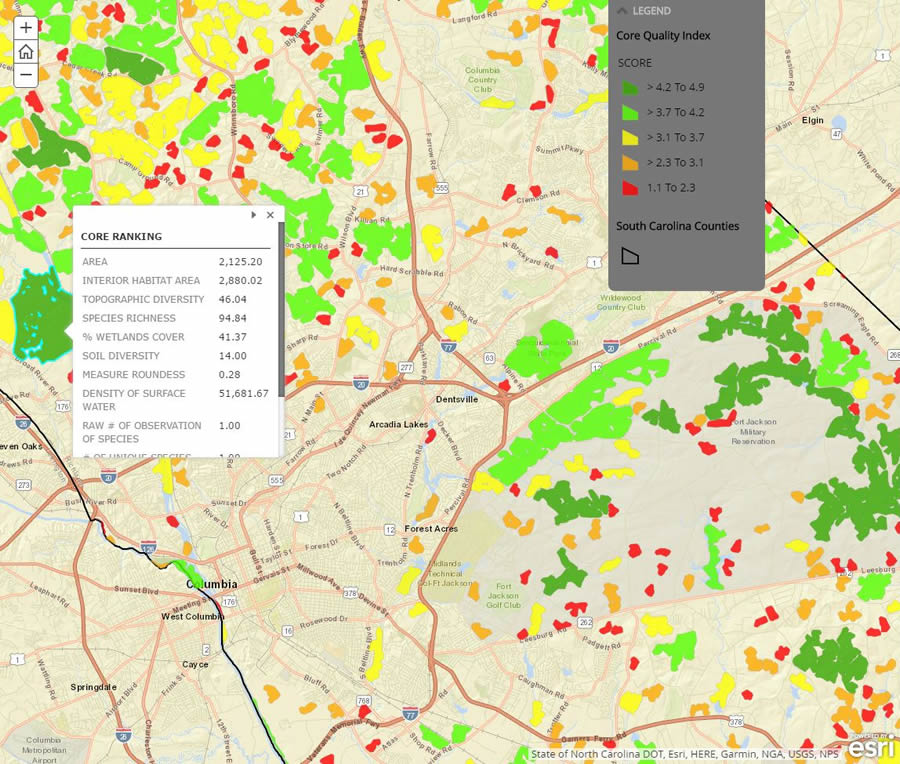
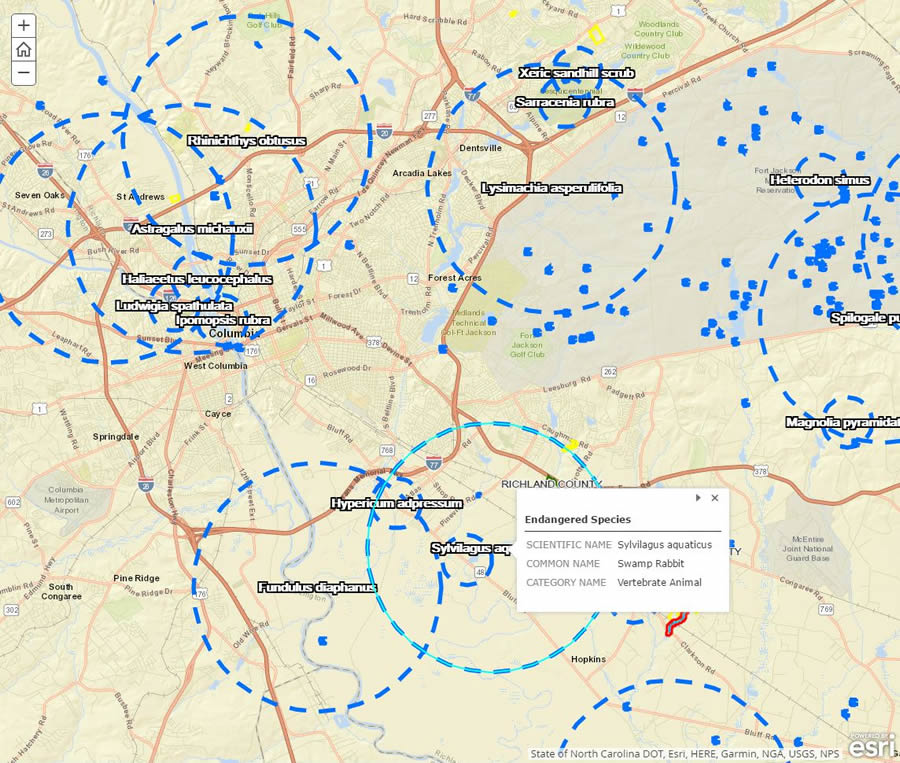
Carter gave a presentation on Richland County’s green infrastructure project during the 2017 Geodesign Summit. She showed a green infrastructure story map that outlines the goals of the project and displays interactive maps with the results of the habitat analyses she did using GIS. Core habitats were identified and ranked based on factors such as rare, threatened, and endangered species; wetland and dune areas; and length of streams within a forested area.
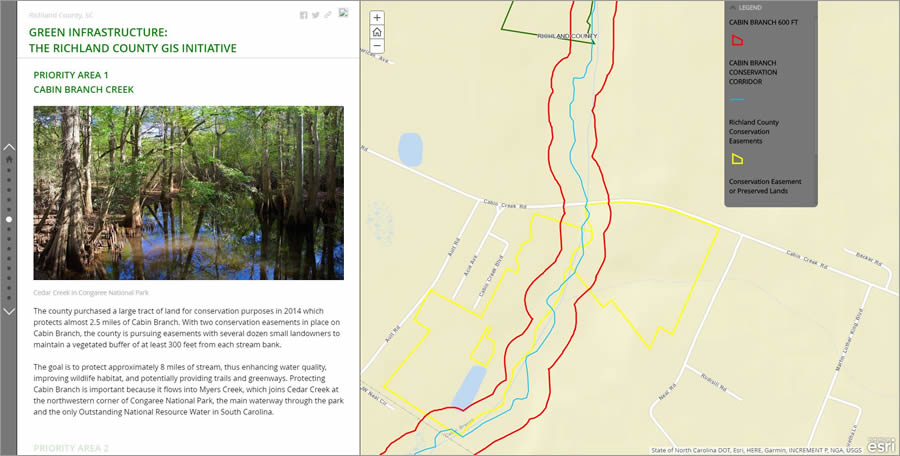
One of the maps shows the locations of endangered plants and animals, including the Alabama black cherry tree, the southern hognose snake, and the banded killfish. The story map lists four priority areas for future conservation, including Cabin Branch Creek, an area south of Columbia where, according to Carter’s story map, Richland County has already bought land for preservation and plans to acquire easements from several property owners.
The green infrastructure initiative currently serves as only a planning guideline for future development within the county. Carter was assigned to the GIS portion of the project in the wake of major flooding that wracked South Carolina in October 2015, when Hurricane Joaquin brought torrential rains to the state. Columbia alone was doused with more than 12 inches of rain, while other parts of the state received more than 20 inches. About 160,000 homes sustained damage.
Earthen dams that people had built along streams to create ponds broke loose after days of rain, sending water downstream to low-lying areas, Carter said. “You had little creeks that became big rivers that washed out roads and railroad trestles,” she said. “Bridges were completely washed out, and we had road closures.”
The damage to the homes built in the floodplains was the impetus for the green infrastructure project. Where possible, the idea is to leave more areas along streams and in floodplains undeveloped in order to reduce the chance of flood damage to houses and infrastructure in the future.
Richland County was named for its fertile soil, which yielded crops such as indigo and cotton. As in many other parts of the country, agriculture has given way to development in recent years.
But Carter hopes that the green infrastructure project she worked on will help South Carolina maintain some of the rural character that marked her childhood, when she fished, rode a horse, and played in the woods.
“We want to grow,” she said, “but we don’t want to destroy our natural resources while we are growing.”

