The prizewinning entries in this year’s Esri Storytelling with Maps Contest reflect a happy trend: as the community of story map authors has grown, the quality of the stories they produce has notably improved. That is evident after even a quick look at this year’s winning story maps, which tackled topics that included prehistoric floods in Washington state, a wild rickshaw ride across India, and a solemn remembrance of a concentration camp in Poland.
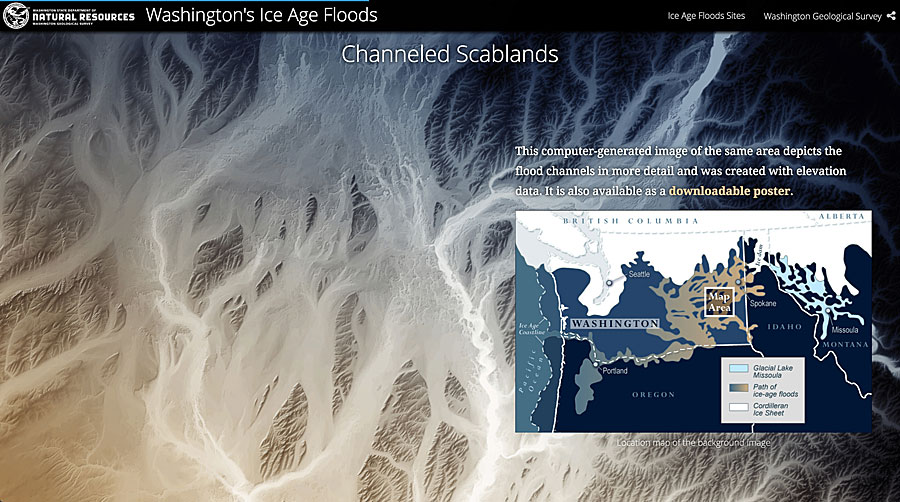
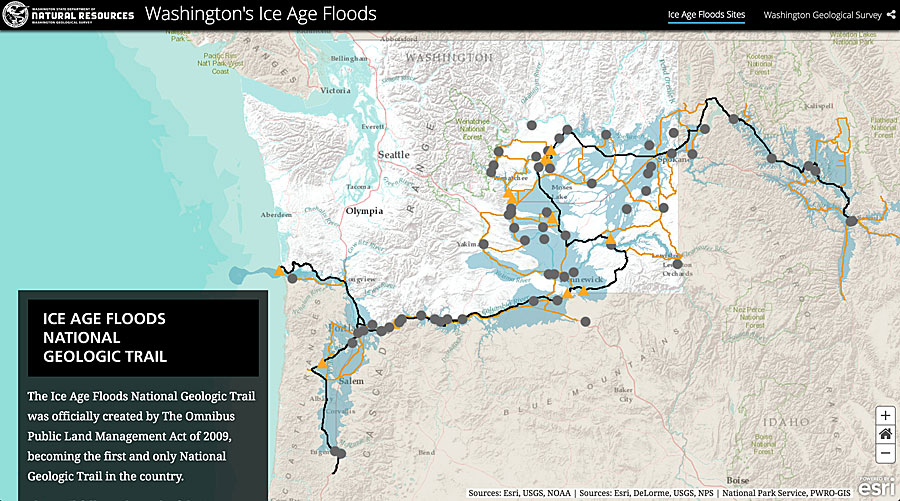
The highest honors went to Daniel Coe, of the State of Washington Geological Survey, who won the grand prize for Washington’s Ice Age Floods and an additional award for Native Trees of the Pacific Northwest: A Geographic Guide, which he created in his free time. You might call it beginner’s luck, as these were the first two story maps Coe ever made. But after speaking with Coe about his creations, we discovered there was a lot of skill behind the luck.
Perhaps the secret of Coe’s success is in his background, which combines art and geography. “I’ve always been kind of addicted to travel, and I can stare at a road atlas for five hours,” he said. “That, combined with liking to draw and paint, naturally led me to cartography.” Coe attended the Art Institute of Pittsburgh in Pennsylvania in the late 1990s and later earned a geography degree from Portland State University in Oregon.
Washington’s Ice Age Floods reconstructs the vast floods that, 15,000 years ago, swept across what is now Washington state. Using the Esri Story Map Cascadeapp, he combined photos, video, animations, lidar imagery, and beautiful cartography to dramatically depict the sequence of events that left deep scars on the landscape, including the Channeled Scablands of southeast Washington.
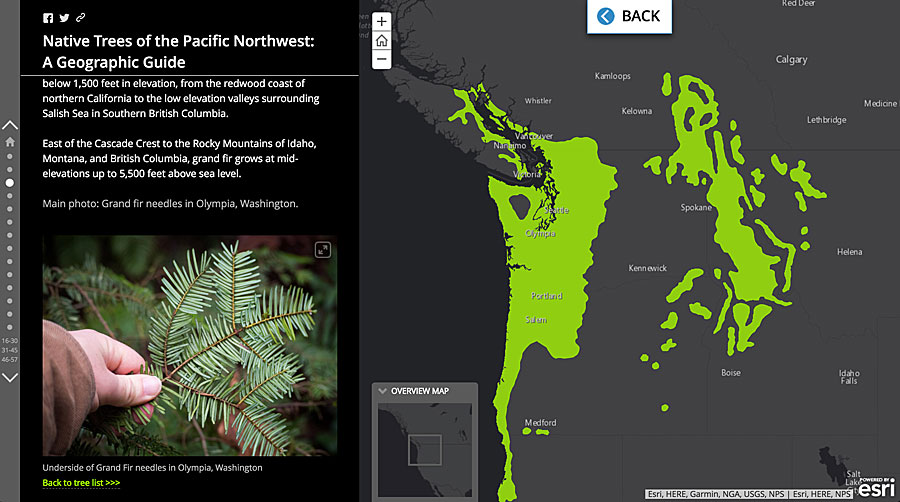
Coe won second place in the contest’s Science, Technology, and Education category for his Native Trees of the Pacific Northwest guide, which he created using the Esri Story Map Journal app. “[The project] started off as my wanting to learn [how to use] the app,” Coe said.
An accomplished amateur photographer, Coe already had an extensive collection of forest photographs. He used a series of tree range shapefiles from the United States Geological Survey (USGS), from which he produced a series of handsome web maps. Coe spent time in the field photographing additional trees to fill out his collection. His seemingly informal project turned into a six-month effort.
Since Coe created the Washington’s Ice Age Floods story map as a function of his job for the State of Washington, he will bring the prizes—a 3DR Solo Drone; a one-year, one-user Drone2Map for ArcGIS license; and the GoPro HERO4 Silver edition camera—back to his organization.
This year’s Esri Storytelling with Maps Contest attracted more than 750 entries from a wide array of individuals and organizations, including municipal governments, state agencies, nonprofits, and educational institutions. Although the number of entries was comparable to last year’s contest, it was not the quantity but the quality of the finalists’ story maps that made judging challenging.
The story maps team convened for two rounds of preliminary judging, winnowing the entries to a few dozen finalists. Despite the improvement in overall quality, many story maps were quickly eliminated during judging because of relatively basic errors and oversights, such as map pop-ups that hadn’t been configured or images or map elements that weren’t shared publicly, making some of the content in the story map or even the entire story map inaccessible.
Here’s some advice for aspiring story map authors: peruse the ArcGIS blog for tips on how to make your story map effective. This instructional story map, called 13 Ways to Make Your Story Map Sing, gives some basic, helpful advice.
The final round of judging was done by a panel of journalists with expertise in mapping and graphics, including John Duchneskie, assistant managing editor for design and graphics at the Philadelphia Inquirer; David Dudley, interim editor at CityLab; and David Mellnik, database editor at the Washington Post. [Editor’s note: Carroll also helped with the judging, tapping into his experience as former chief cartographer at National Geographic.]
The Esri Storytelling with Maps Contest honored Coe and 13 other winners and three honorable mentions, including the following:
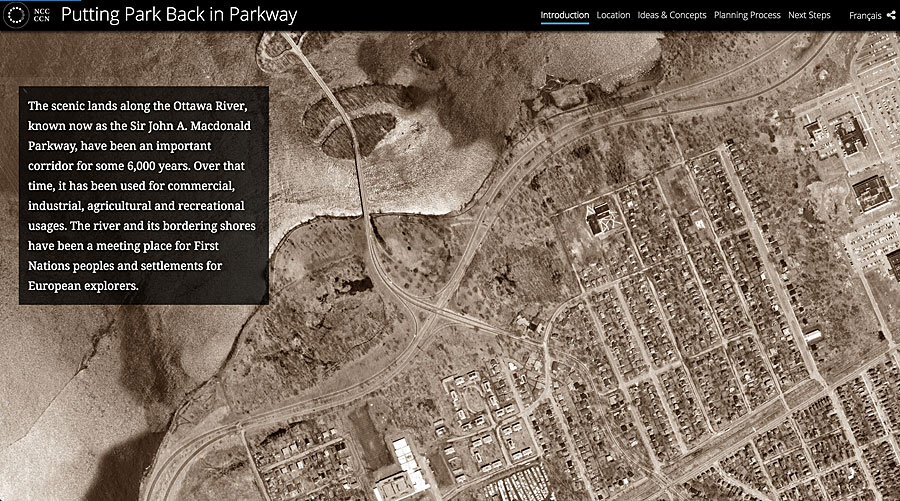
- The National Capital Commission in Canada won first prize in the Infrastructure, Planning, and Government category for Putting Park Back in Parkway, which uses the Esri Story Map Cascade app to inform the citizens of Ottawa, Canada, about the Sir John A. Macdonald Riverfront Park Plan. The story map skillfully combines archival and current photography with static and dynamic maps to present a plan to enhance a greenway along the Ottawa River.
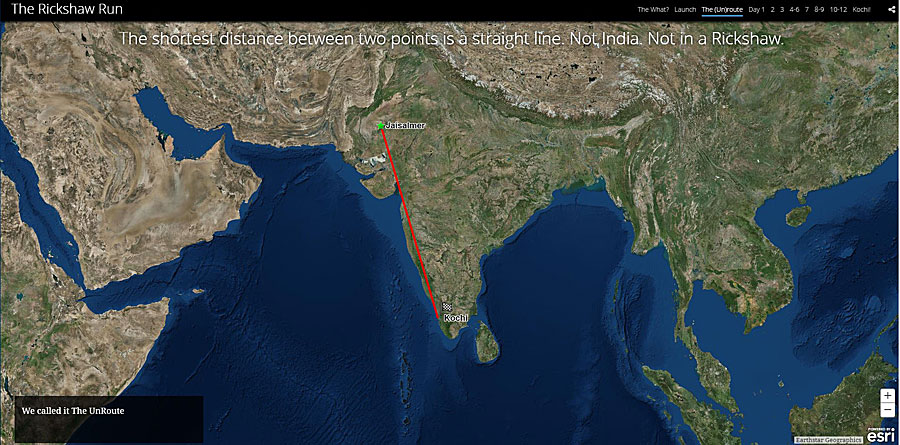
- Chris Counsell of Australia won first prize in the Travel, Destinations, and Recreation category for The Rickshaw Run, an entertaining account of an offbeat adventure in India. Counsell and his brother, Will, persuaded their father to celebrate his 60th birthday with a 3,000-kilometer rickshaw ride across India. The Rickshaw Run features a series of full-screen video clips that give viewers a vivid, you-are-there sense of the men’s sometimes hilarious misadventures.
- The University of Minnesota Institute on the Environment’s insightful story map, Diverse Farms, Diverse Foods: Farm Size and Nutrient Diversity, placed first in the Conservation, Environment, and Sustainability category. The institute conducts important research on world agriculture and food supply issues. This is the organization’s first story map and demonstrates the authors’ skill at communicating their research through vivid maps, photographs, infographics, and satellite imagery.
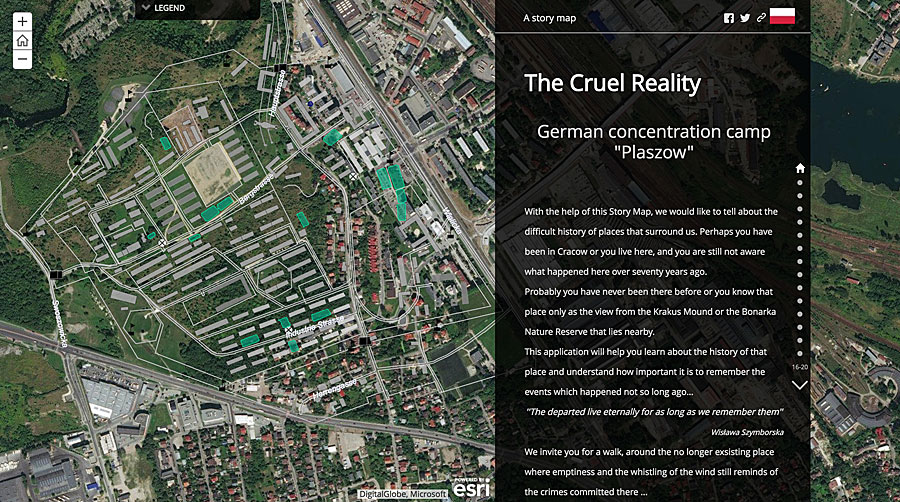
- Anna Kurylowicz and Marzena Koziak, of the AGH University of Science and Technology in Poland, won first prize in the Culture, History, and Events category for their story map, The Cruel Reality. The story map tells the history of Płaszów, a German concentration camp in Cracow, Poland. It places a detailed map—of the long-destroyed concentration camp—atop a modern aerial photograph of an apparently innocuous landscape in Cracow. The Cruel Reality locates and identifies the camp’s buildings while describing how prisoners were forced into labor: quarrying limestone, making uniforms for SS officers, and working in factories. Some 8,000 prisoners died during the camp’s yearlong existence. The story map superbly demonstrates the power of maps to bring history to life, preserving the memory of a dark past.
- Downtown Reborn, by Kevin Howard, Leslie Fletcher, M. J. Simpson, Scott Aulen, and Scott Bachman of the City of Greenville, South Carolina, won second prize in the Infrastructure, Planning, and Government category. The story map illustrates how downtown Greenville has gone from floundering to thriving over the past 40 years. Viewers can scroll through time to see how a multitude of forces fostered the veritable transformation.
View the complete list of the 2017 Esri Storytelling with Maps Contest winners.
