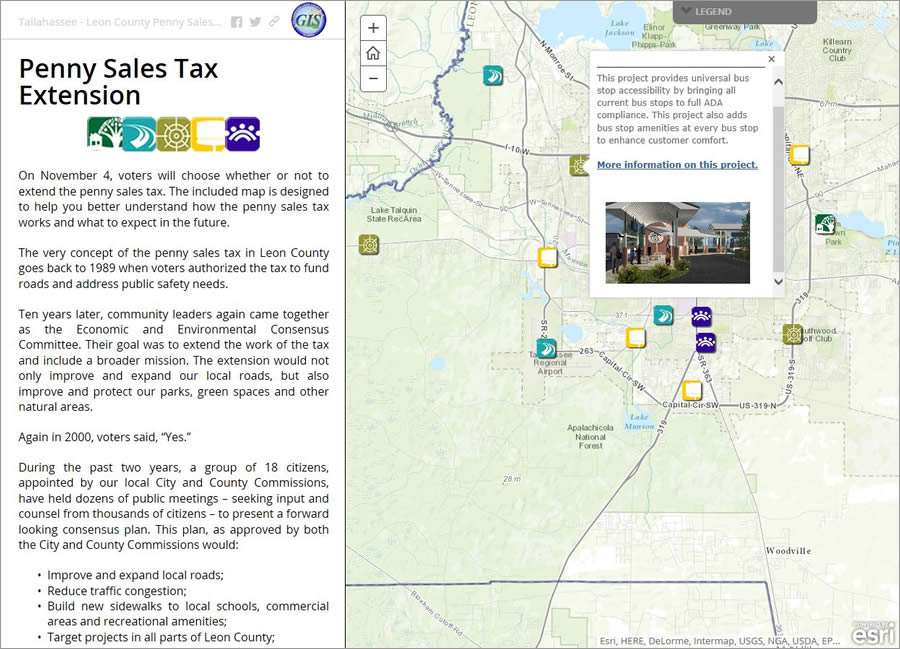
When Scott Weisman first saw the Esri Story Map Journal unveiled at the 2014 Esri User Conference Plenary Session, he knew it might be the perfect app for a new web map that Tallahassee-Leon County GIS (TLCGIS) wanted to create.
Weisman, GIS manager for TLCGIS, immediately sent a text message with a link to the app to his colleague Ned Cake in Florida that said, “Please take a look. What do you think? Penny Sales Tax?”
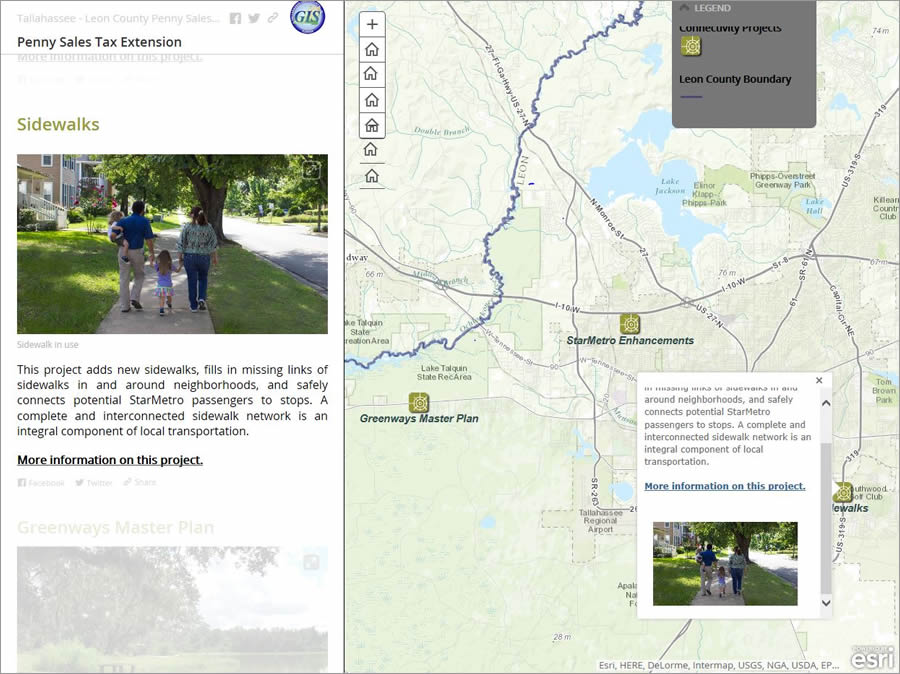
TLCGIS teamed up with other county staff to develop this interactive map for the Penny Sales Tax Extension project, a public-awareness campaign for the referendum held November 4, on extending a one-cent local government infrastructure tax.
Esri marketing writer Carla Wheeler interviewed Cake, the GIS integration specialist at TLCGIS, about why the Journal app was so well suited for the Penny Sales Tax Extension map and other upcoming public information projects.
Wheeler: Why did this app appeal to you?
Cake: Aesthetically, the Journal app has a unique combination of eye appeal and a clean design. What really struck me was its ability to provide incredibly focused map content combined with the impact of images, text, video, social media links, and customizable map interaction. And that’s just in the first section! Each additional section has its own impact on the user and its own story to tell. In every section, I can reuse many of the same ArcGIS Online resources, add some new content, completely refocus the Journal on a new location, and tell another related story. The impact of an application that can transition smoothly from one story concept and map to the next in a logical order was a game changer for this project.
Wheeler: Why was using the Journal app a smarter choice for creating this particular story map about the Penny Sales Tax Extension? I know you initially thought about using another app such as the Esri Story Map Tour or a customized version of the Esri Story Map tabbed. Does the Story Map Journal long form narrative work well for a story about infrastructure projects?
Cake: Why the long form? The simple answer: because sections within the Journal are independently linkable by URL parameter, so each section can stand alone almost as its own web page. We felt that the ability to link to individual sections from our other sites and social media helped to offset concerns regarding the overall length of the Journal. Additional consideration for branding, styling, custom map symbols, and mobile responsiveness also made this template more attractive than the Story Map Tour app. These abilities, combined with the ease of publication, close integration with ArcGIS Online, phenomenal end-user experience, and overall flexibility—no other Story Map app or mapping application comes close.

Wheeler: Was the Story Map Journal easy or difficult to build? Was the Map Journal Builder that helps you create the app helpful?
Cake: At first glance, the Journal looks so impressive [that] you might think it was difficult to make. However, we’ve found that it takes considerably longer to gather the content than it does to build the Journal. The Map Journal Builder is very simple to use. In our first configuration effort, because we had all the content in advance, we were able to configure a working Journal within about six hours. The content took considerably longer for Leon County’s Community and Media Relations group to gather.
Once you have mastered the Map Journal Builder and gathered your content, a simple Journal Story Map [app] could take as little as three hours to configure. Some other Story Map [apps] are even simpler to build. Using Esri’s Snap2Map smartphone application, we were able to build a very nice Story Map Tour in about 45 minutes using only a smartphone on a 4G connection.
Wheeler: How does your GIS department collaborate with other departments within your agency on projects using ArcGIS Online and Story Map apps?
Cake: The TLCGIS management team has taken a unique approach to ArcGIS Online for organizations. We view our ArcGIS Online organization and Story Map apps as tools that will extend GIS into the departments that we serve and enhance their interaction with the public. We feel that this enabling approach gives ArcGIS Online and Story Map apps a distinct advantage over traditional application development models. For example, to kick off the Penny Sales Tax project, TLCGIS met with the Community and Media Relations [CMR] group to translate its needs for this project into a workable GIS schema. Using this schema, TLCGIS created an empty point feature layer in our ArcGIS Online organization [account] and turned it over to the CMR staff to populate. While we assisted with configuration of the Story Map apps in this instance, in the future we expect some of the groups we support to develop their own Story Map apps with minimal assistance from TLCGIS.
Wheeler: You mentioned some other future Story Map journals. What do you have planned?
Cake: The success of the Penny Sales Tax project has led to more requests for Story Map apps. When we talk to other departments about their web GIS needs, Penny Sales Tax seems to be the first thing they mention: “Can we do something like that?” Consequently, we have several new Story Map apps that are in the works:
Farm Tour 2014—This Story Map Journal app features 35 farms within 200 miles of Leon County that were open for tours in October 2014. It was developed in cooperation with the Leon County Office of Sustainability and a local food cooperative.
Growing Green—This Journal app will feature local farmers’ markets, community gardens, and sustainability-related content. It replaces an existing Flex viewer application. It is being developed in cooperation with the Leon County Office of Sustainability.
Bike Tallahassee—This Journal app will display designated bike routes, facilities, and networks. It is being developed in cooperation with the Tallahassee Leon County Planning Department.
The Great Tree Challenge—The Great Tree Challenge Story Map Journal will feature patriarchal trees in the community, crowd sourced by citizens using Esri’s GeoForm app. They will identify trees and gather information with GeoForm, a configurable app template that enables form-based data collection and placing features on a map interactively or using device location capabilities. The app will work on smartphones, mobile devices, and in desktop browsers. The trees will be added to the Story Map Journal.
