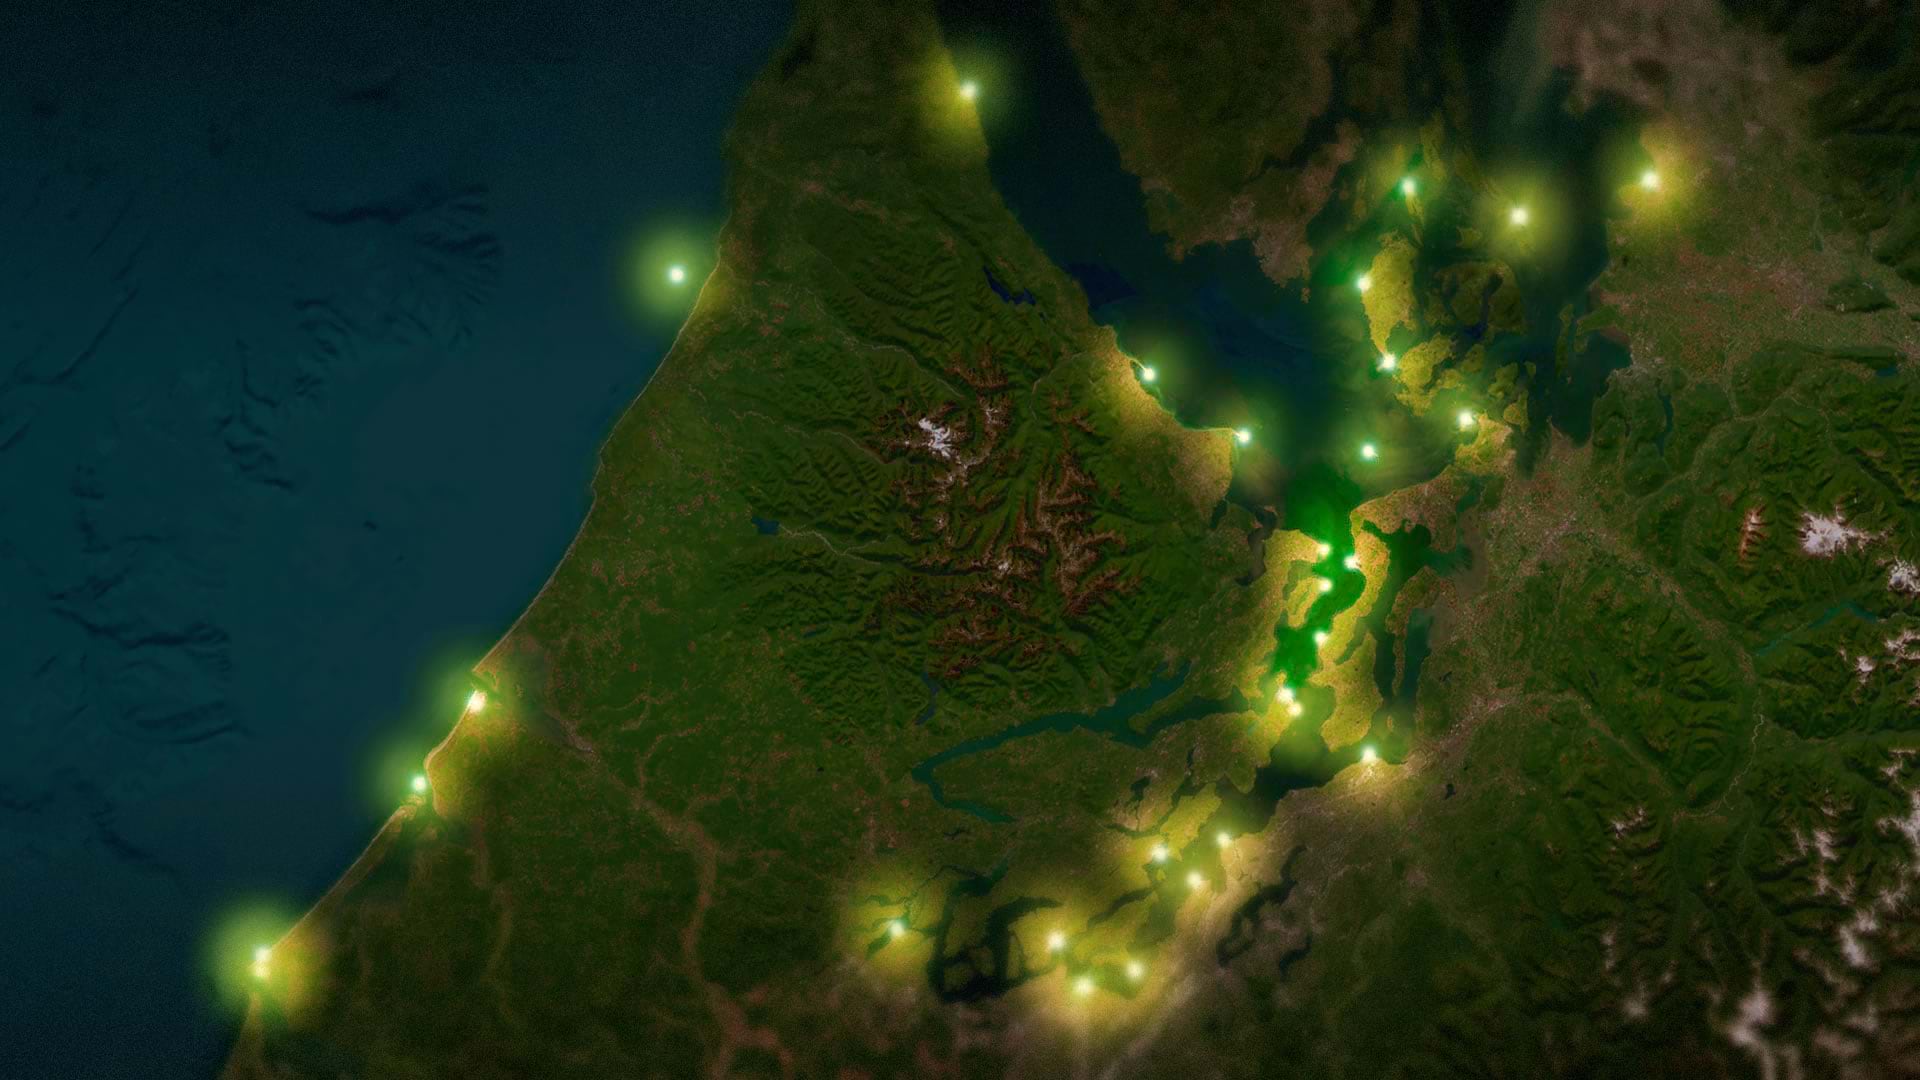
Sometimes showing points on a map isn’t enough. Luckily, there are a variety of effects in ArcGIS Online that you can use to reflect the focus of your map.
As an example, imagine you’re creating a story in ArcGIS StoryMaps about lighthouses in the US Pacific Northwest, and you’d like to make your map look as though the lighthouses are illuminating the land and water around them.
In ArcGIS Online, there’s a way to do this. Rather than simply having discrete points on a basemap, geographic points can act as light sources that reveal the underlying map. Learn how in this tip.
Adding a Lighthouses Layer from ArcGIS Online
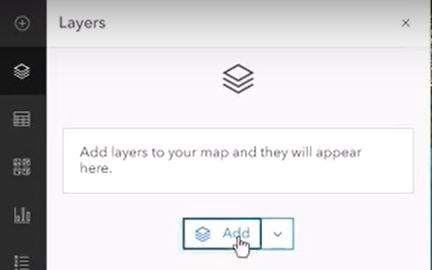
Step 1: Open a new map with the Imagery basemap in ArcGIS Online, select the Layers icon from the black toolbar on the left side of the app, then click the Add button.
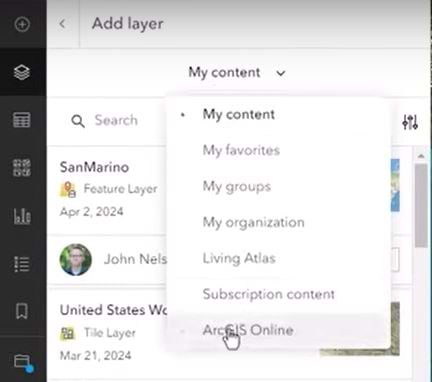
Select ArcGIS Online from the drop-down on the My content tab.
Step 2: Use the search bar to search for lighthouses. Find the layer entitled Washinton_Lighthouses. This layer shows lighthouse locations in Washington, the northernmost state on the US West Coast. Click the Add button for this layer. This will open a Properties panel on the right side of the window.
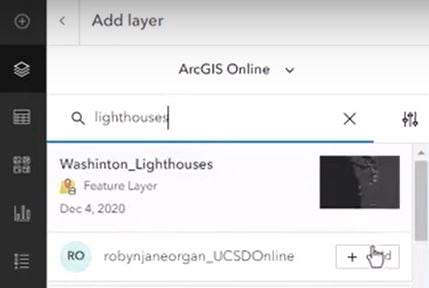
Click the < symbol to the left of Add layer.

Adding Firefly Point Symbology
Step 3: Next, we’ll make the lighthouse locations look like little glowing sources of light rather than the default map symbols.
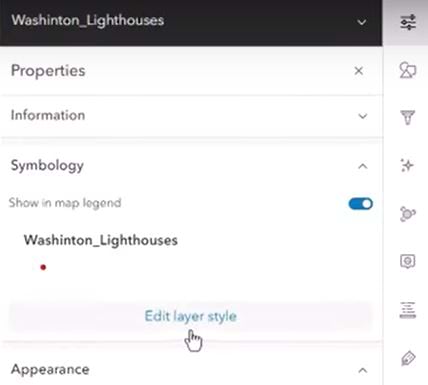
In the Properties panel, look for the Symbology section. Under Washinton_Lighthouses, choose Edit layer style.
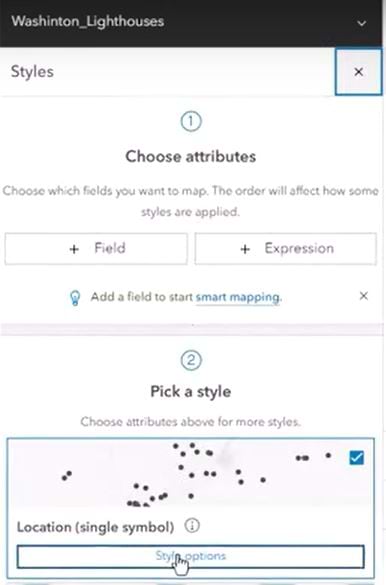
In the Styles panel, under Pick a Style, click the Style options button.
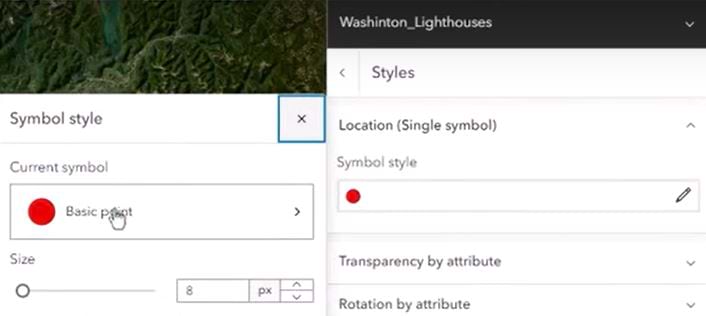
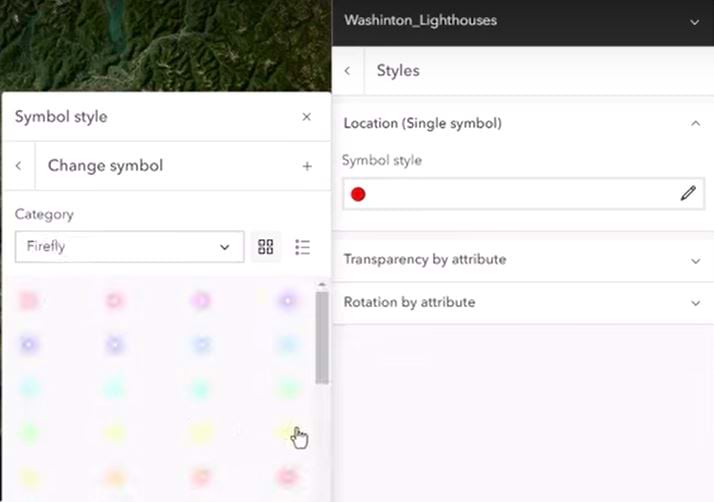
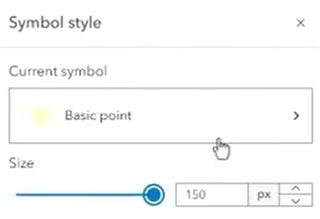
Step 4: In the Styles panel, click the box that contains a red dot. In the Symbol style list that appears to the left, choose the box under Current symbol that reads Basic point.
The words “Change symbol” will appear. Under Change symbol, click Basic shapes. The drop-down menu will reveal a list of options.
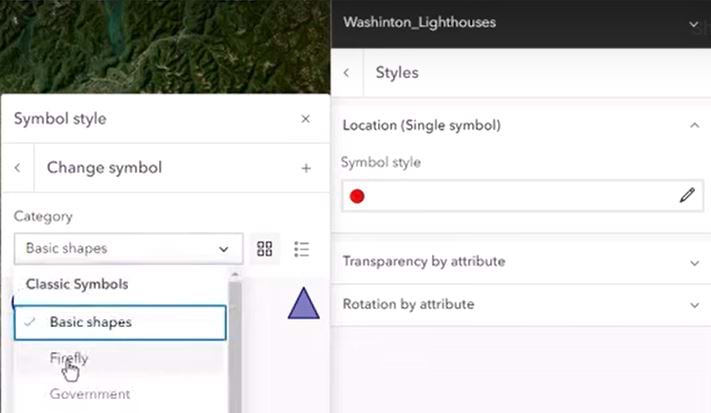
Choose Firefly, then choose the yellow symbol from the fourth column of symbol options. Now click Done.
Save your work.
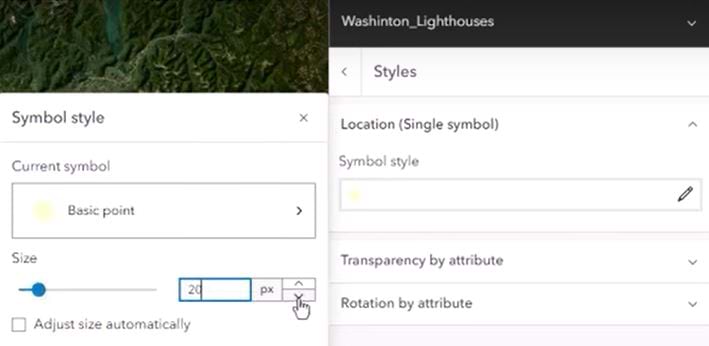
Step 5: From the Symbol style options, set the size to 20 px, then close the Symbol style panel by clicking the x to the right of Symbol style.
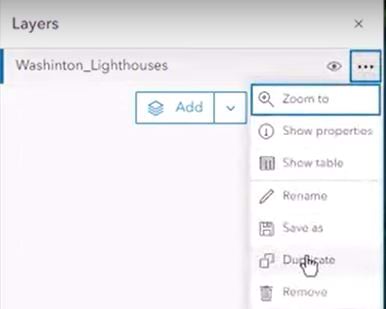
Step 6: Now we’ll duplicate this layer in preparation for changing its characteristics to show an illumination effect.
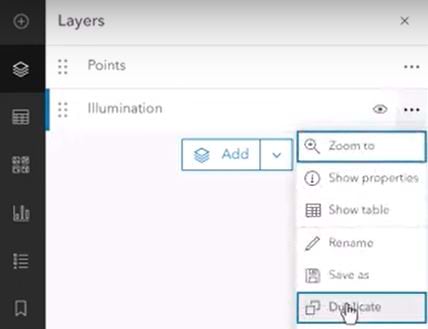
From the Layers panel on the left, click the three dots to the right of the words Washinton_Lighthouses, then choose Duplicate from the list that appears.
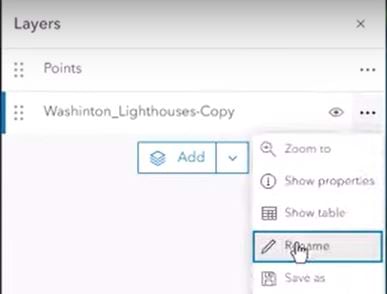
A new layer name that reads Washinton_Lighthouses-Copy will appear. Using the six dots to the left of the layer name, drag the layer name so that it is below Washinton_Lighthouses.

Step 7: Now we’ll provide clearer names for these two layers.
In the panel on the left, click the three dots to the right of Washinton_Lighthouses and select Rename to change the title to Points. Follow the same steps to change the Washinton_Lighthouses-Copy layer name to Illumination. Confirm that the Illumination layer is selected by noting the thin vertical blue line to the left of the six dots. We will only work with the Illumination layer for the rest of the steps.
Step 8: Now we’ll boost the size of this effect to expand the illumination area for the Illumination layer.
From the panel on the right, under Pick a Style, click Style options.
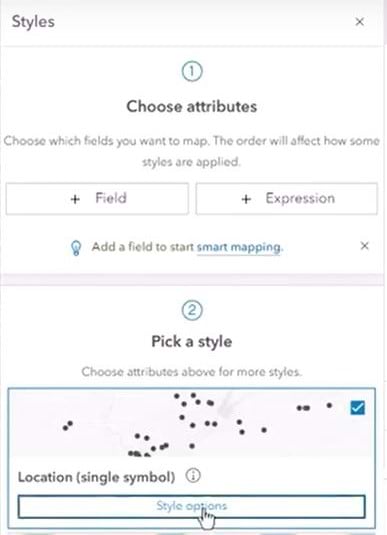
Under Symbol style, select the box with the yellow dot.
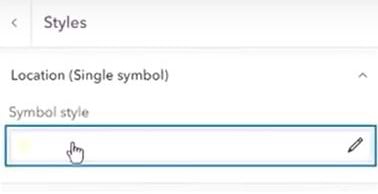
Now change the size of the symbol for the Illumination layer from 20 px to 150 px. Close the Symbol style panel by clicking the x to the right of Symbol style.
Save your work.
Darkening the Underlying Imagery Basemap
Now we’ll darken the imagery basemap so that the Illumination layer has something to illuminate–like lighthouses brightening dark areas.
Step 9: Choose the Basemap icon from the black toolbar on the left side of the app.
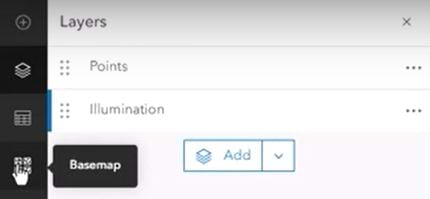
In the Basemap panel, click Imagery.

Select World Imagery.
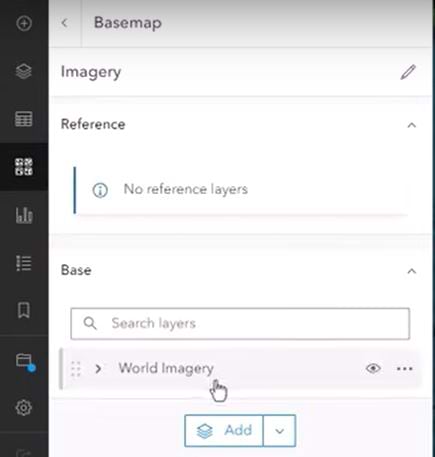
This will open the World Imagery panel on the right side of the app.
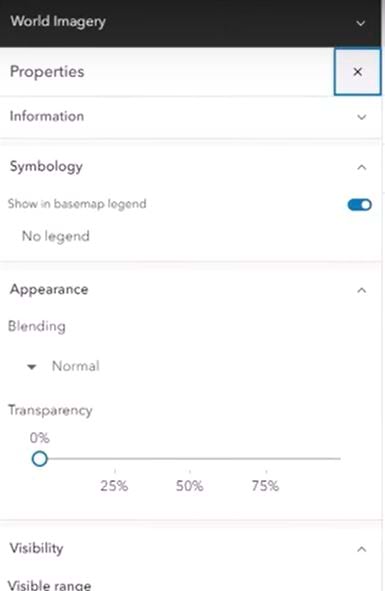
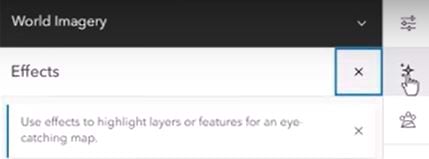
Step 10: From the white toolbar to the right of the World Imagery panel, select the Effects icon.
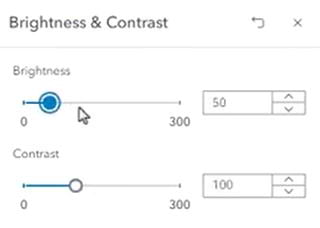
Choose the Brightness & Contrast option to activate that effect.
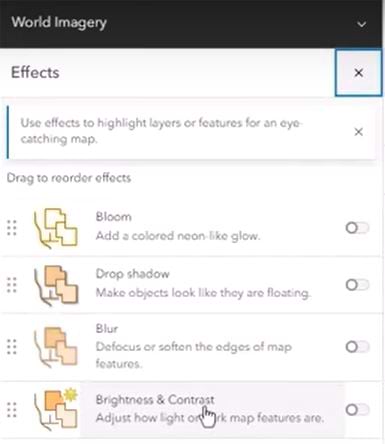
In the box that appears to the left, set the brightness at 50, which is darker than normal, and then set the contrast to 100, which is normal. Close this box by clicking on the x to the right of Brightness & Contrast.
Save your work.
Step 11: Choose Layers again from the black toolbar on the left. In the Layers panel, make sure the Illumination layer is selected.

Now click the Properties icon from the top of the white toolbar on the right side of the app.

In the Properties panel that appears, under Blending, click Normal.
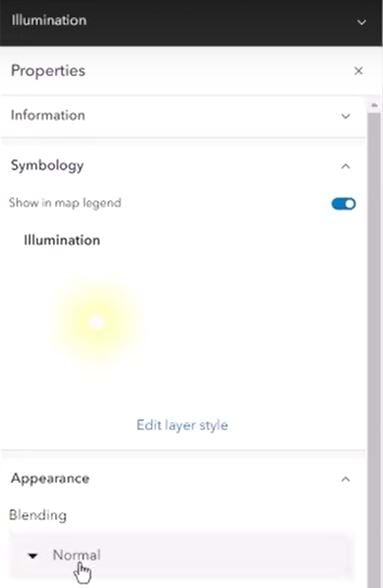
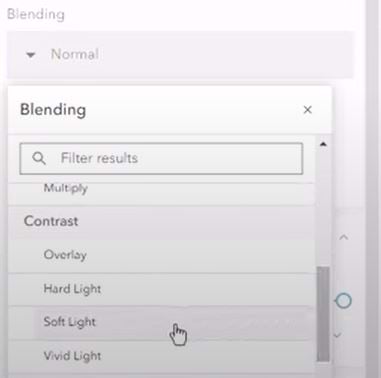
Use the scroll bar that appears under the word Normal to find and select Soft Light, under the Contrast heading. Close this box by clicking on the x to the right of the word Blending.
Creating an Illumination Effect with the Soft Light Blend Mode
Step 12: Go back to the Layers panel on the left. Use the eye icon to the right of Illumination to see “before” and “after” versions of the map.

To boost this illumination effect even further, click the three dots on the right side of the Illumination layer line and select Duplicate. Another layer, entitled Illumination-Copy, will appear in the Layers list.
Step 13: To review your map, find the stacked icons at the bottom right of the map. Select the third icon from the top—the one that looks like a monitor. This will maximize the map image by hiding the panels and toolbars on the left and right. You should see a yellow glow around the lighthouse locations—a paint-with-light effect that fits the energy of a lighthouse map.
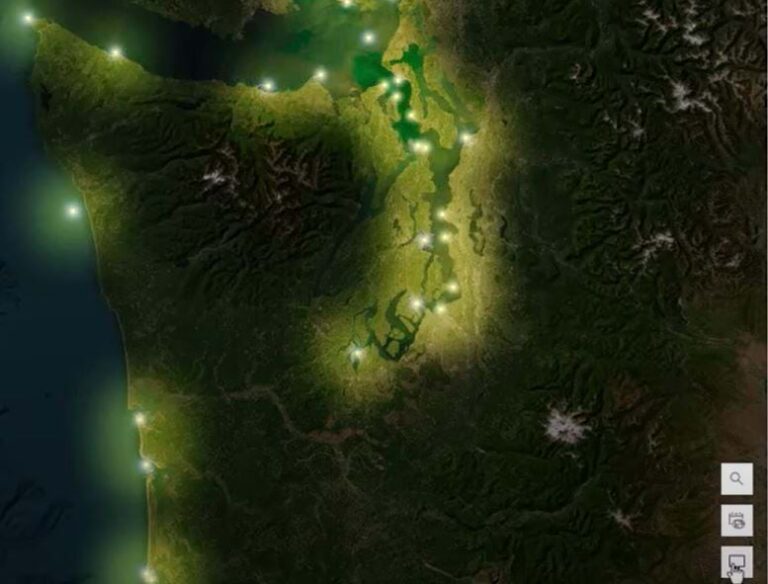
Save your work.
Remember, your data doesn’t have to be literal points of light like in this Lighthouse layer; there are many themes or ArcGIS StoryMaps stories that might benefit from an illumination effect similar to this one.
Watch a video of this process or subscribe to John Nelson Maps on YouTube.
