Esri Press Publishes Three Books that Focus on Spatial Analysis
GIS is a framework for gathering, managing, and analyzing data. Three new books from Esri Press focus heavily on the analytical capabilities of GIS.
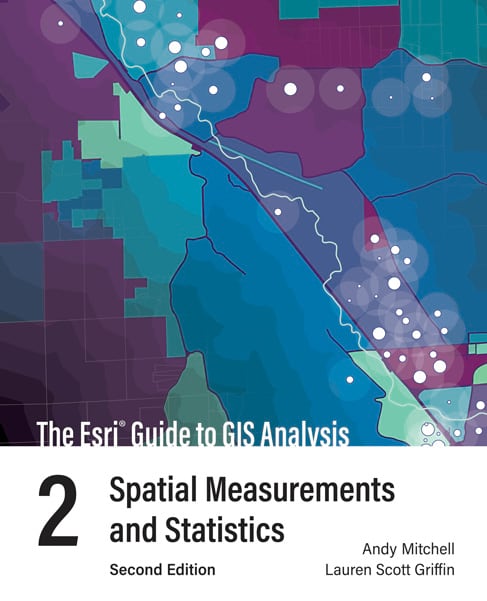
The Esri Guide to GIS Analysis, Volume 2: Spatial Measurements and Statistics, Second Edition
This book focuses on how to use spatial measurements and statistics to analyze geospatial data.
The Esri Guide to GIS Analysis, Volume 2: Spatial Measurements and Statistics, coauthored by Esri technical writer Andy Mitchell and Esri product engineer Lauren Scott Griffin, underscores why it’s unnecessary to understand complex mathematical theories to apply spatial statistics tools in GIS projects.
Readers will learn basic statistical concepts and how they are applied to spatial data, using tools in ArcGIS to accomplish tasks such as measuring geographic distributions, identifying patterns and clusters, and analyzing geographic relationships.
The book uses relatable examples and maps and graphics when covering various topics.
For instance, maps in the book show how change in the spatial distribution of features, such as the location of dengue fever cases, can be tracked over time to determine where the disease is spreading. Other maps illustrate how statistics can be used to identify hot or cold spots that indicate statistically significant clusters or locations of auto thefts, earthquake epicenters, or even moose sightings.
“In this essential guide, [the authors] bring each algorithm and method to life by focusing on the problems they solve and the ways they can be used to answer important questions,” Lauren Bennett, Esri software development lead in spatial analysis and data science, wrote in the book’s foreword. “This is a book written for everyone, and you will walk away with a deep understanding of how these spatial statistics work and with the confidence to use them in your own analysis.”
(Print edition ISBN: 9781589486089, $49.99; e-book edition ISBN: 9781589486096, $49.99)

Understanding Crime: Analyzing the Geography of Crime
Crime science expert Spencer Chainey is an advocate of data-driven public safety and hot spot policing programs.
Now Chainey, an associate professor at University College London, has written a comprehensive guide to the analysis techniques that can be used to investigate the geography of crime.
In Understanding Crime: Analyzing the Geography of Crime, Chainey covers topics such as the following:
- The principal geographic theories of crime
- Hot spot analysis, including the examination of clusters and spatial concentrations of crime
- The temporal analysis of crime
- The application of spatial regression analysis to crime data
- Mapping and analyzing crime risk
In the book’s preface, the author asks people to avoid skipping chapter 1 because it focuses on theories rather than techniques.
“To understand crime, and to interpret the patterns we observe, we must draw from the theory behind crime,” Chainey wrote.

The book isn’t a how-to guide on how to use ArcGIS tools for crime analysis. It does, however, provide detailed descriptions, explanations, and illustrations of spatial analysis techniques and spatial statistics tools in ArcGIS that can be used by law enforcement officers, students, analysts, and researchers in the quest to better understand crime and its patterns.
“Improving how we analyze crime is what motivated me to write this book,” wrote Chainey.
Key learning points are included at the start of each chapter, with a summary and references appearing at the end. Throughout the book, readers will also see boxes with additional information, such as definitions of terms, that will help them better understand a theoretical principle or a technical issue.
Chainey is the director of continuing professional development and the director of the Latin America and Caribbean unit at University College London’s Jill Dando Institute of Security and Crime Science. His academic research supports many facets of policing, including criminal investigations, crime reduction, and public safety.
(Print edition ISBN: 9781589485846, $79.99; e-book edition ISBN: 9781589485853, $79.99)
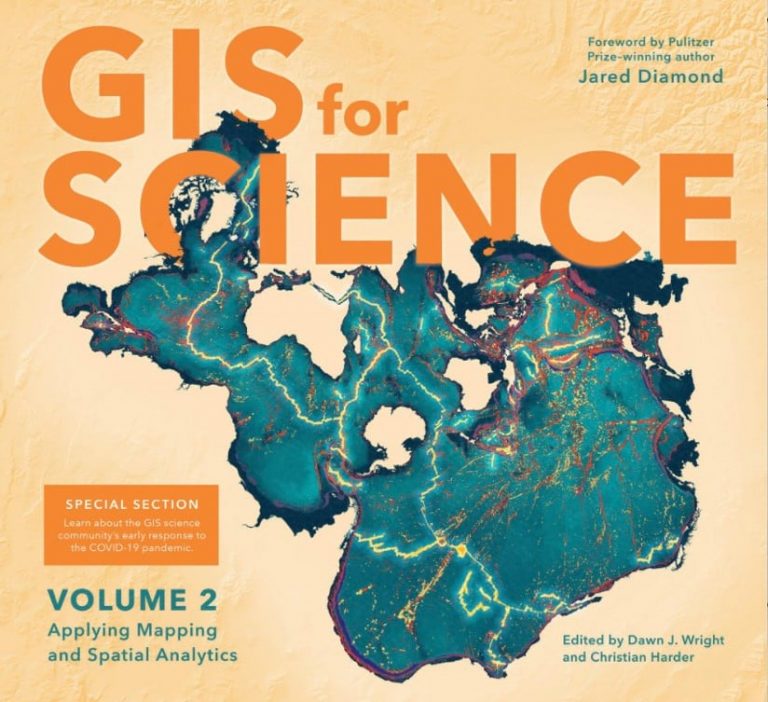
GIS for Science: Applying Mapping and Spatial Analytics, Volume 2
The latest volume of GIS for Science: Applying Mapping and Spatial Analytics tells the stories of scientists who use GIS and spatial data science in a variety of fields, such as public health, in relation to the COVID-19 pandemic, geology, oceanography, disaster response and recovery, resilience and reporting, air quality, and sustainable precision agriculture.
One chapter, “The Geography of Ocean Plastics,” focuses on the problem of plastics that get into the ocean, become part of garbage patches, and ultimately harm marine life. The case study highlights how GIS tools can be used to combine multiple data sources and investigate spatiotemporal patterns that reveal how various migrating marine animal species have been exposed to plastics that are moving in the ocean.
“Understanding the exposure that marine animals face when they encounter plastic debris is a crucial first step toward estimating—and ultimately mitigating—the impact of this insidious and long-lasting pollution on marine ecosystems,” wrote the chapter’s authors.

The book also includes an interview with Lauren Gardner, the cocreator of the Johns Hopkins University (JHU) COVID-19 dashboard that was developed by the university’s Center for Systems Science and Engineering (CSSE). Using Esri ArcGIS technology, the JHU researchers mapped COVID-19 cases globally. The dashboard has received billions of online views.
Other chapters highlight the use of GIS technology to help farmers analyze data to boost sustainable precision agriculture efforts and help researchers analyze the loss of forests in countries such as Brazil, Colombia, Indonesia, and the Democratic Republic of the Congo (DRC).
The stories in the book show how ArcGIS software and the ArcGIS Online cloud- based system work as a comprehensive geospatial platform to support research, collaboration, spatial analysis, and science communication across many communities.
The book includes an online companion with resources, including data, tools, and videos, that complement the case studies published in the book.
GIS for Science: Applying Mapping and Spatial Analytics was coedited by Dawn J. Wright, Esri chief scientist, and Christian Harder, a technology writer and information designer at Esri. Wright is a geographer and oceanographer and a leading expert in the application of GIS to environmental science. Harder has authored and coauthored many GIS books, including The ArcGIS Book and The ArcGIS Imagery Book.
(Print edition ISBN: 9781589485877, $39.99; e-book edition ISBN: 9781589485884, $39.99)

